Moroccan vs Immigrants from Eritrea 10th Grade
COMPARE
Moroccan
Immigrants from Eritrea
10th Grade
10th Grade Comparison
Moroccans
Immigrants from Eritrea
93.5%
10TH GRADE
25.3/ 100
METRIC RATING
196th/ 347
METRIC RANK
92.5%
10TH GRADE
0.3/ 100
METRIC RATING
271st/ 347
METRIC RANK
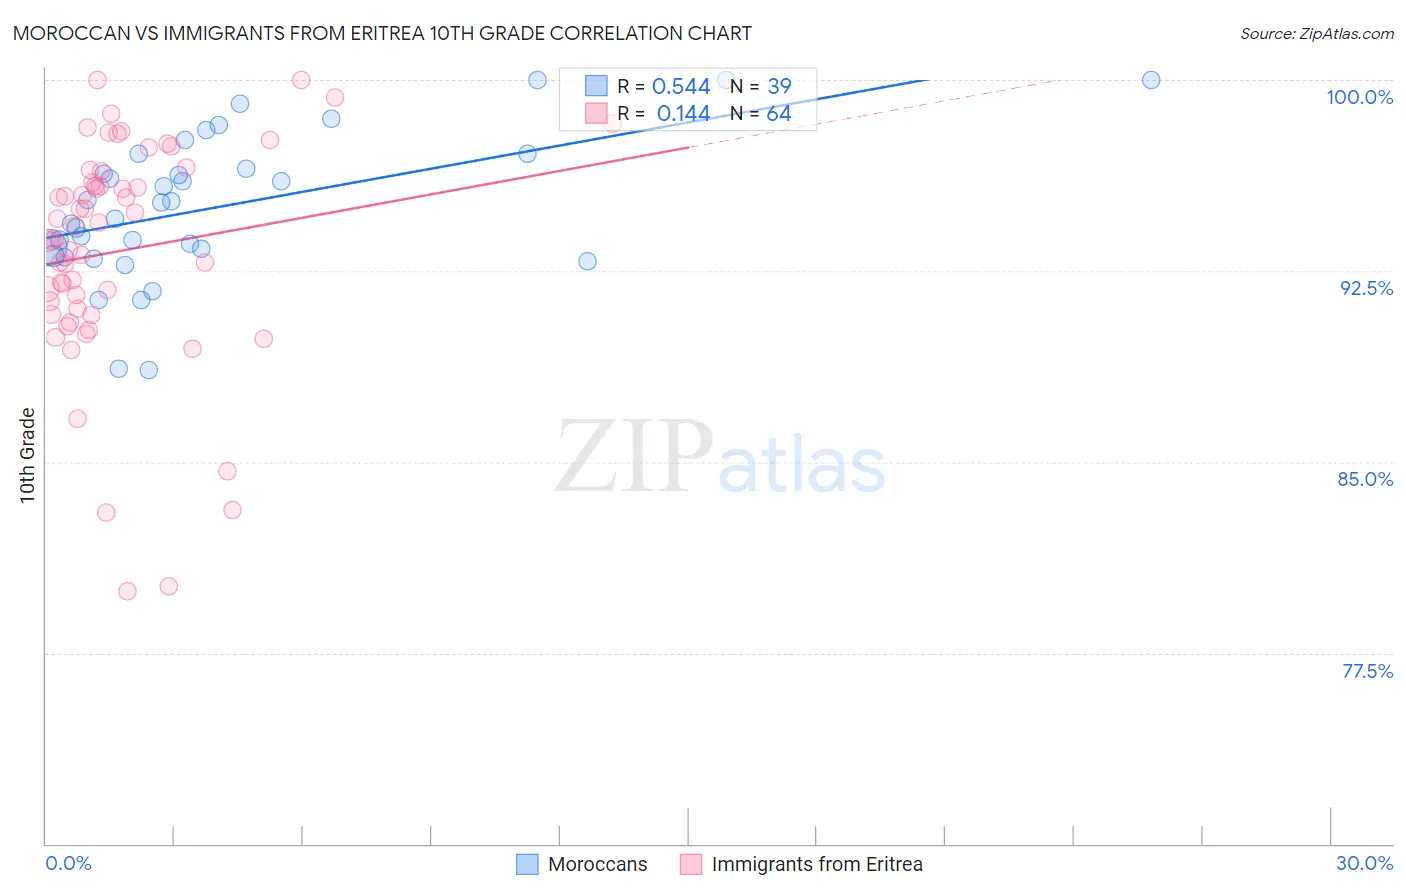
Moroccan vs Immigrants from Eritrea 10th Grade Correlation Chart
The statistical analysis conducted on geographies consisting of 201,817,667 people shows a substantial positive correlation between the proportion of Moroccans and percentage of population with at least 10th grade education in the United States with a correlation coefficient (R) of 0.544 and weighted average of 93.5%. Similarly, the statistical analysis conducted on geographies consisting of 104,754,230 people shows a poor positive correlation between the proportion of Immigrants from Eritrea and percentage of population with at least 10th grade education in the United States with a correlation coefficient (R) of 0.144 and weighted average of 92.5%, a difference of 1.1%.
10th Grade Correlation Summary
| Measurement | Moroccan | Immigrants from Eritrea |
| Minimum | 88.6% | 79.9% |
| Maximum | 100.0% | 100.0% |
| Range | 11.4% | 20.1% |
| Mean | 95.0% | 93.3% |
| Median | 95.2% | 94.0% |
| Interquartile 25% (IQ1) | 93.1% | 90.9% |
| Interquartile 75% (IQ3) | 97.1% | 96.2% |
| Interquartile Range (IQR) | 4.0% | 5.3% |
| Standard Deviation (Sample) | 2.8% | 4.4% |
| Standard Deviation (Population) | 2.8% | 4.4% |
Similar Demographics by 10th Grade
Demographics Similar to Moroccans by 10th Grade
In terms of 10th grade, the demographic groups most similar to Moroccans are Immigrants from Morocco (93.5%, a difference of 0.020%), Cheyenne (93.5%, a difference of 0.020%), Pueblo (93.5%, a difference of 0.020%), Immigrants from Malaysia (93.5%, a difference of 0.030%), and Panamanian (93.5%, a difference of 0.030%).
| Demographics | Rating | Rank | 10th Grade |
| Immigrants | Pakistan | 32.5 /100 | #189 | Fair 93.6% |
| Laotians | 32.1 /100 | #190 | Fair 93.6% |
| Yup'ik | 31.1 /100 | #191 | Fair 93.6% |
| Immigrants | Malaysia | 28.0 /100 | #192 | Fair 93.5% |
| Panamanians | 28.0 /100 | #193 | Fair 93.5% |
| Immigrants | Morocco | 26.9 /100 | #194 | Fair 93.5% |
| Cheyenne | 26.8 /100 | #195 | Fair 93.5% |
| Moroccans | 25.3 /100 | #196 | Fair 93.5% |
| Pueblo | 23.9 /100 | #197 | Fair 93.5% |
| Immigrants | Micronesia | 23.2 /100 | #198 | Fair 93.5% |
| Asians | 23.0 /100 | #199 | Fair 93.5% |
| Hopi | 22.2 /100 | #200 | Fair 93.5% |
| Hawaiians | 21.8 /100 | #201 | Fair 93.5% |
| Immigrants | Uganda | 20.9 /100 | #202 | Fair 93.5% |
| Immigrants | Western Asia | 20.6 /100 | #203 | Fair 93.4% |
Demographics Similar to Immigrants from Eritrea by 10th Grade
In terms of 10th grade, the demographic groups most similar to Immigrants from Eritrea are Immigrants from Uruguay (92.5%, a difference of 0.010%), Immigrants from Western Africa (92.5%, a difference of 0.010%), Immigrants from Colombia (92.5%, a difference of 0.020%), Taiwanese (92.5%, a difference of 0.030%), and Immigrants from Ghana (92.5%, a difference of 0.030%).
| Demographics | Rating | Rank | 10th Grade |
| Peruvians | 0.4 /100 | #264 | Tragic 92.6% |
| Dutch West Indians | 0.4 /100 | #265 | Tragic 92.6% |
| Immigrants | Philippines | 0.4 /100 | #266 | Tragic 92.6% |
| Taiwanese | 0.3 /100 | #267 | Tragic 92.5% |
| Immigrants | Ghana | 0.3 /100 | #268 | Tragic 92.5% |
| Immigrants | Colombia | 0.3 /100 | #269 | Tragic 92.5% |
| Immigrants | Uruguay | 0.3 /100 | #270 | Tragic 92.5% |
| Immigrants | Eritrea | 0.3 /100 | #271 | Tragic 92.5% |
| Immigrants | Western Africa | 0.3 /100 | #272 | Tragic 92.5% |
| Trinidadians and Tobagonians | 0.2 /100 | #273 | Tragic 92.4% |
| Immigrants | Congo | 0.2 /100 | #274 | Tragic 92.4% |
| West Indians | 0.2 /100 | #275 | Tragic 92.4% |
| Immigrants | Trinidad and Tobago | 0.1 /100 | #276 | Tragic 92.3% |
| Navajo | 0.1 /100 | #277 | Tragic 92.3% |
| Barbadians | 0.1 /100 | #278 | Tragic 92.2% |