Moroccan vs Jordanian 10th Grade
COMPARE
Moroccan
Jordanian
10th Grade
10th Grade Comparison
Moroccans
Jordanians
93.5%
10TH GRADE
25.3/ 100
METRIC RATING
196th/ 347
METRIC RANK
94.4%
10TH GRADE
95.6/ 100
METRIC RATING
118th/ 347
METRIC RANK
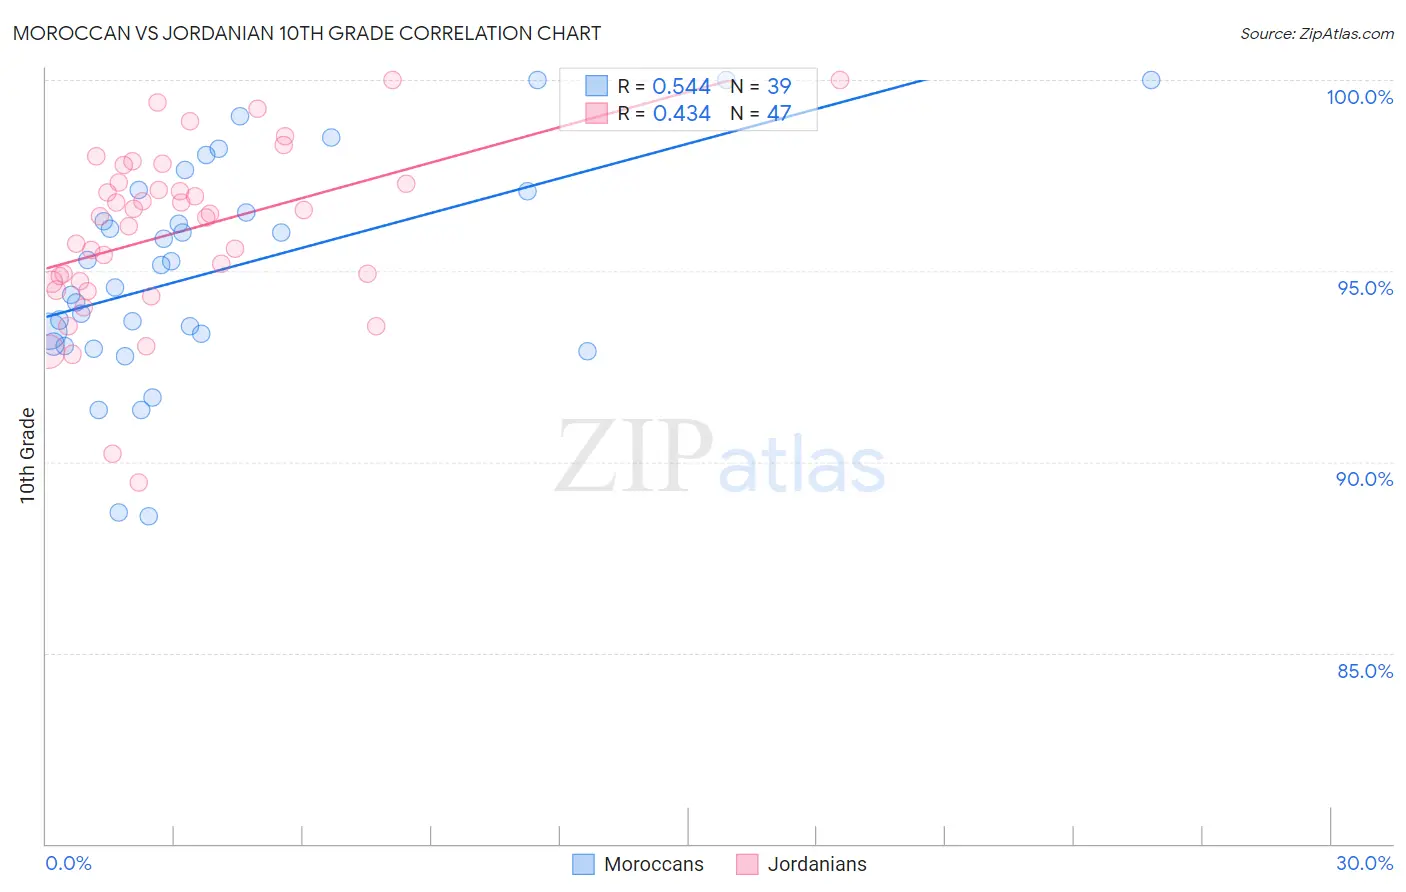
Moroccan vs Jordanian 10th Grade Correlation Chart
The statistical analysis conducted on geographies consisting of 201,817,667 people shows a substantial positive correlation between the proportion of Moroccans and percentage of population with at least 10th grade education in the United States with a correlation coefficient (R) of 0.544 and weighted average of 93.5%. Similarly, the statistical analysis conducted on geographies consisting of 166,402,085 people shows a moderate positive correlation between the proportion of Jordanians and percentage of population with at least 10th grade education in the United States with a correlation coefficient (R) of 0.434 and weighted average of 94.4%, a difference of 0.93%.
10th Grade Correlation Summary
| Measurement | Moroccan | Jordanian |
| Minimum | 88.6% | 89.5% |
| Maximum | 100.0% | 100.0% |
| Range | 11.4% | 10.5% |
| Mean | 95.0% | 96.0% |
| Median | 95.2% | 96.4% |
| Interquartile 25% (IQ1) | 93.1% | 94.7% |
| Interquartile 75% (IQ3) | 97.1% | 97.3% |
| Interquartile Range (IQR) | 4.0% | 2.6% |
| Standard Deviation (Sample) | 2.8% | 2.3% |
| Standard Deviation (Population) | 2.8% | 2.2% |
Similar Demographics by 10th Grade
Demographics Similar to Moroccans by 10th Grade
In terms of 10th grade, the demographic groups most similar to Moroccans are Immigrants from Morocco (93.5%, a difference of 0.020%), Cheyenne (93.5%, a difference of 0.020%), Pueblo (93.5%, a difference of 0.020%), Immigrants from Malaysia (93.5%, a difference of 0.030%), and Panamanian (93.5%, a difference of 0.030%).
| Demographics | Rating | Rank | 10th Grade |
| Immigrants | Pakistan | 32.5 /100 | #189 | Fair 93.6% |
| Laotians | 32.1 /100 | #190 | Fair 93.6% |
| Yup'ik | 31.1 /100 | #191 | Fair 93.6% |
| Immigrants | Malaysia | 28.0 /100 | #192 | Fair 93.5% |
| Panamanians | 28.0 /100 | #193 | Fair 93.5% |
| Immigrants | Morocco | 26.9 /100 | #194 | Fair 93.5% |
| Cheyenne | 26.8 /100 | #195 | Fair 93.5% |
| Moroccans | 25.3 /100 | #196 | Fair 93.5% |
| Pueblo | 23.9 /100 | #197 | Fair 93.5% |
| Immigrants | Micronesia | 23.2 /100 | #198 | Fair 93.5% |
| Asians | 23.0 /100 | #199 | Fair 93.5% |
| Hopi | 22.2 /100 | #200 | Fair 93.5% |
| Hawaiians | 21.8 /100 | #201 | Fair 93.5% |
| Immigrants | Uganda | 20.9 /100 | #202 | Fair 93.5% |
| Immigrants | Western Asia | 20.6 /100 | #203 | Fair 93.4% |
Demographics Similar to Jordanians by 10th Grade
In terms of 10th grade, the demographic groups most similar to Jordanians are Immigrants from Hungary (94.4%, a difference of 0.010%), Immigrants from Israel (94.4%, a difference of 0.010%), Immigrants from Taiwan (94.4%, a difference of 0.010%), Immigrants from Belarus (94.4%, a difference of 0.020%), and Inupiat (94.4%, a difference of 0.020%).
| Demographics | Rating | Rank | 10th Grade |
| Immigrants | Zimbabwe | 96.8 /100 | #111 | Exceptional 94.4% |
| Immigrants | Kuwait | 96.8 /100 | #112 | Exceptional 94.4% |
| Palestinians | 96.5 /100 | #113 | Exceptional 94.4% |
| German Russians | 96.3 /100 | #114 | Exceptional 94.4% |
| Delaware | 96.3 /100 | #115 | Exceptional 94.4% |
| Sioux | 96.2 /100 | #116 | Exceptional 94.4% |
| Immigrants | Hungary | 95.8 /100 | #117 | Exceptional 94.4% |
| Jordanians | 95.6 /100 | #118 | Exceptional 94.4% |
| Immigrants | Israel | 95.4 /100 | #119 | Exceptional 94.4% |
| Immigrants | Taiwan | 95.3 /100 | #120 | Exceptional 94.4% |
| Immigrants | Belarus | 95.2 /100 | #121 | Exceptional 94.4% |
| Inupiat | 95.1 /100 | #122 | Exceptional 94.4% |
| Cree | 95.1 /100 | #123 | Exceptional 94.4% |
| Basques | 94.9 /100 | #124 | Exceptional 94.3% |
| Americans | 94.4 /100 | #125 | Exceptional 94.3% |