Malaysian vs Immigrants from Bangladesh Professional Degree
COMPARE
Malaysian
Immigrants from Bangladesh
Professional Degree
Professional Degree Comparison
Malaysians
Immigrants from Bangladesh
3.4%
PROFESSIONAL DEGREE
0.2/ 100
METRIC RATING
302nd/ 347
METRIC RANK
4.4%
PROFESSIONAL DEGREE
56.0/ 100
METRIC RATING
171st/ 347
METRIC RANK
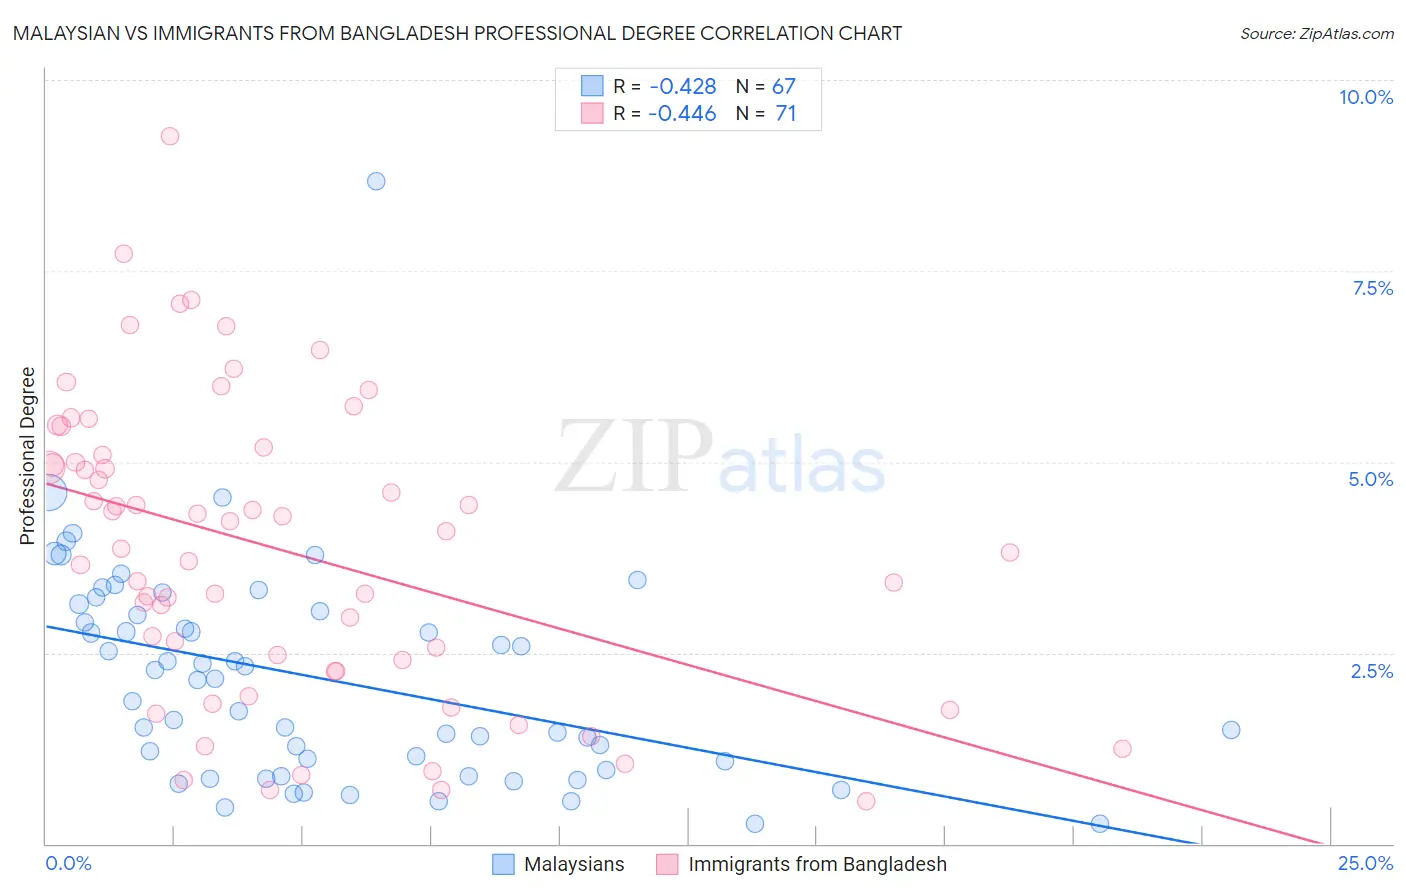
Malaysian vs Immigrants from Bangladesh Professional Degree Correlation Chart
The statistical analysis conducted on geographies consisting of 225,764,269 people shows a moderate negative correlation between the proportion of Malaysians and percentage of population with at least professional degree education in the United States with a correlation coefficient (R) of -0.428 and weighted average of 3.4%. Similarly, the statistical analysis conducted on geographies consisting of 203,559,674 people shows a moderate negative correlation between the proportion of Immigrants from Bangladesh and percentage of population with at least professional degree education in the United States with a correlation coefficient (R) of -0.446 and weighted average of 4.4%, a difference of 31.0%.
Professional Degree Correlation Summary
| Measurement | Malaysian | Immigrants from Bangladesh |
| Minimum | 0.26% | 0.56% |
| Maximum | 8.7% | 9.3% |
| Range | 8.4% | 8.7% |
| Mean | 2.2% | 3.8% |
| Median | 2.1% | 3.9% |
| Interquartile 25% (IQ1) | 0.97% | 2.3% |
| Interquartile 75% (IQ3) | 3.1% | 5.1% |
| Interquartile Range (IQR) | 2.1% | 2.8% |
| Standard Deviation (Sample) | 1.4% | 1.9% |
| Standard Deviation (Population) | 1.4% | 1.9% |
Similar Demographics by Professional Degree
Demographics Similar to Malaysians by Professional Degree
In terms of professional degree, the demographic groups most similar to Malaysians are Immigrants from Dominican Republic (3.4%, a difference of 0.11%), Black/African American (3.4%, a difference of 0.25%), Immigrants from Yemen (3.4%, a difference of 0.38%), Immigrants from Haiti (3.4%, a difference of 0.66%), and Cajun (3.4%, a difference of 0.66%).
| Demographics | Rating | Rank | Professional Degree |
| Immigrants | Guatemala | 0.2 /100 | #295 | Tragic 3.4% |
| Hawaiians | 0.2 /100 | #296 | Tragic 3.4% |
| Immigrants | Liberia | 0.2 /100 | #297 | Tragic 3.4% |
| Ottawa | 0.2 /100 | #298 | Tragic 3.4% |
| Immigrants | Yemen | 0.2 /100 | #299 | Tragic 3.4% |
| Blacks/African Americans | 0.2 /100 | #300 | Tragic 3.4% |
| Immigrants | Dominican Republic | 0.2 /100 | #301 | Tragic 3.4% |
| Malaysians | 0.2 /100 | #302 | Tragic 3.4% |
| Immigrants | Haiti | 0.2 /100 | #303 | Tragic 3.4% |
| Cajuns | 0.2 /100 | #304 | Tragic 3.4% |
| Chickasaw | 0.1 /100 | #305 | Tragic 3.4% |
| Cape Verdeans | 0.1 /100 | #306 | Tragic 3.4% |
| Samoans | 0.1 /100 | #307 | Tragic 3.3% |
| Shoshone | 0.1 /100 | #308 | Tragic 3.3% |
| Pima | 0.1 /100 | #309 | Tragic 3.3% |
Demographics Similar to Immigrants from Bangladesh by Professional Degree
In terms of professional degree, the demographic groups most similar to Immigrants from Bangladesh are Immigrants from Zaire (4.5%, a difference of 0.22%), Chinese (4.5%, a difference of 0.39%), Immigrants from Sierra Leone (4.5%, a difference of 0.41%), Immigrants from Afghanistan (4.5%, a difference of 0.48%), and Immigrants from Colombia (4.5%, a difference of 0.51%).
| Demographics | Rating | Rank | Professional Degree |
| Swiss | 61.0 /100 | #164 | Good 4.5% |
| Costa Ricans | 59.9 /100 | #165 | Average 4.5% |
| Immigrants | Colombia | 59.4 /100 | #166 | Average 4.5% |
| Immigrants | Afghanistan | 59.2 /100 | #167 | Average 4.5% |
| Immigrants | Sierra Leone | 58.7 /100 | #168 | Average 4.5% |
| Chinese | 58.6 /100 | #169 | Average 4.5% |
| Immigrants | Zaire | 57.4 /100 | #170 | Average 4.5% |
| Immigrants | Bangladesh | 56.0 /100 | #171 | Average 4.4% |
| Spaniards | 52.0 /100 | #172 | Average 4.4% |
| English | 50.1 /100 | #173 | Average 4.4% |
| Kenyans | 50.0 /100 | #174 | Average 4.4% |
| Irish | 50.0 /100 | #175 | Average 4.4% |
| Immigrants | Peru | 49.3 /100 | #176 | Average 4.4% |
| Celtics | 47.6 /100 | #177 | Average 4.4% |
| Immigrants | Costa Rica | 46.7 /100 | #178 | Average 4.4% |