Immigrants from Jordan vs Immigrants from Bangladesh Professional Degree
COMPARE
Immigrants from Jordan
Immigrants from Bangladesh
Professional Degree
Professional Degree Comparison
Immigrants from Jordan
Immigrants from Bangladesh
4.7%
PROFESSIONAL DEGREE
89.0/ 100
METRIC RATING
136th/ 347
METRIC RANK
4.4%
PROFESSIONAL DEGREE
56.0/ 100
METRIC RATING
171st/ 347
METRIC RANK
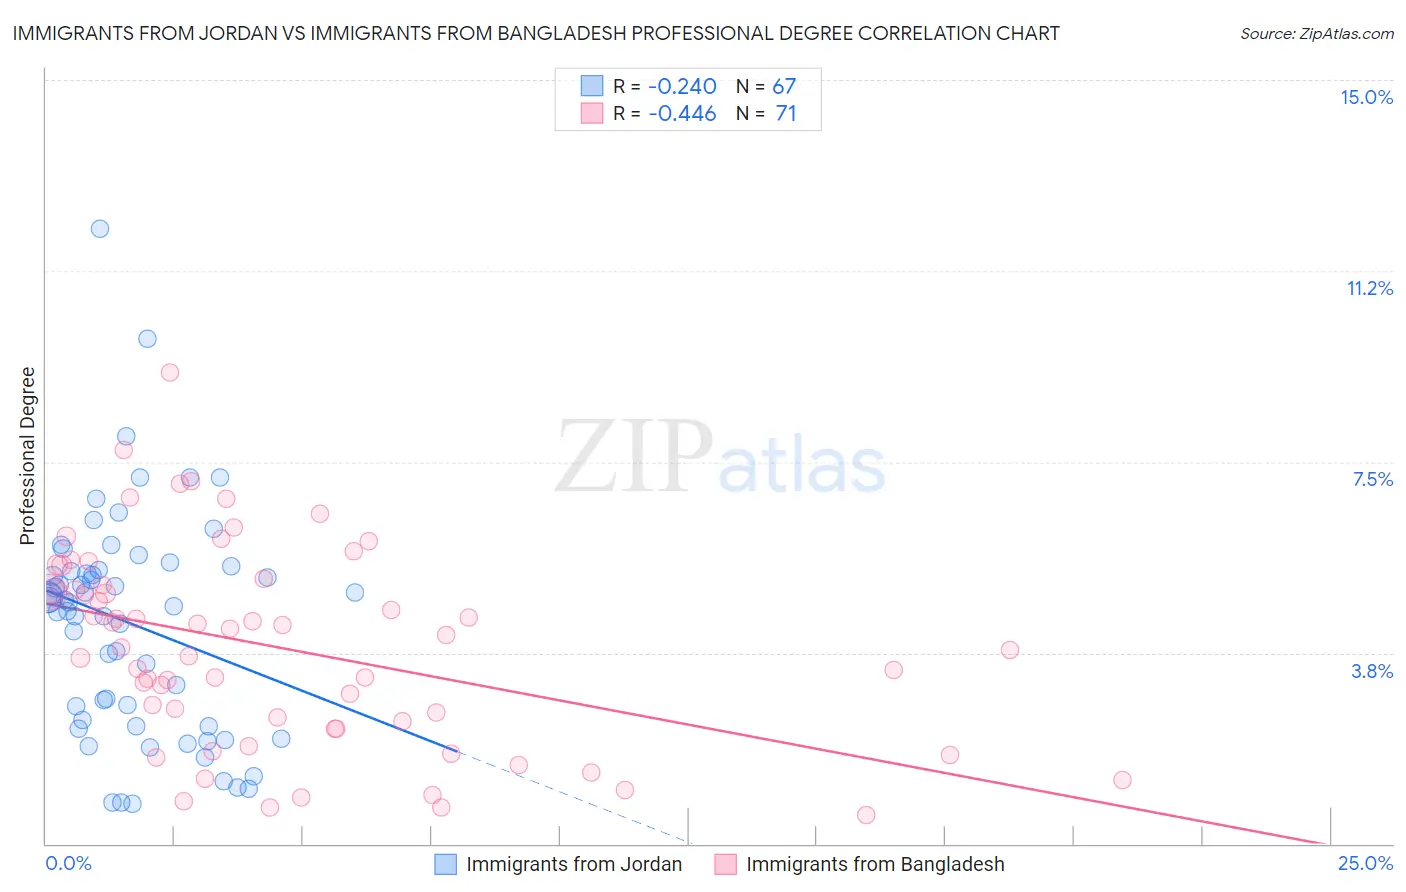
Immigrants from Jordan vs Immigrants from Bangladesh Professional Degree Correlation Chart
The statistical analysis conducted on geographies consisting of 181,207,103 people shows a weak negative correlation between the proportion of Immigrants from Jordan and percentage of population with at least professional degree education in the United States with a correlation coefficient (R) of -0.240 and weighted average of 4.7%. Similarly, the statistical analysis conducted on geographies consisting of 203,559,674 people shows a moderate negative correlation between the proportion of Immigrants from Bangladesh and percentage of population with at least professional degree education in the United States with a correlation coefficient (R) of -0.446 and weighted average of 4.4%, a difference of 6.7%.
Professional Degree Correlation Summary
| Measurement | Immigrants from Jordan | Immigrants from Bangladesh |
| Minimum | 0.78% | 0.56% |
| Maximum | 12.1% | 9.3% |
| Range | 11.3% | 8.7% |
| Mean | 4.3% | 3.8% |
| Median | 4.7% | 3.9% |
| Interquartile 25% (IQ1) | 2.3% | 2.3% |
| Interquartile 75% (IQ3) | 5.4% | 5.1% |
| Interquartile Range (IQR) | 3.1% | 2.8% |
| Standard Deviation (Sample) | 2.2% | 1.9% |
| Standard Deviation (Population) | 2.2% | 1.9% |
Similar Demographics by Professional Degree
Demographics Similar to Immigrants from Jordan by Professional Degree
In terms of professional degree, the demographic groups most similar to Immigrants from Jordan are Jordanian (4.7%, a difference of 0.020%), Afghan (4.7%, a difference of 0.060%), Macedonian (4.8%, a difference of 0.28%), South American Indian (4.8%, a difference of 0.31%), and Italian (4.8%, a difference of 0.44%).
| Demographics | Rating | Rank | Professional Degree |
| Palestinians | 91.5 /100 | #129 | Exceptional 4.8% |
| Icelanders | 91.5 /100 | #130 | Exceptional 4.8% |
| Immigrants | Nepal | 91.4 /100 | #131 | Exceptional 4.8% |
| Pakistanis | 90.9 /100 | #132 | Exceptional 4.8% |
| Italians | 90.2 /100 | #133 | Exceptional 4.8% |
| South American Indians | 89.9 /100 | #134 | Excellent 4.8% |
| Macedonians | 89.8 /100 | #135 | Excellent 4.8% |
| Immigrants | Jordan | 89.0 /100 | #136 | Excellent 4.7% |
| Jordanians | 88.9 /100 | #137 | Excellent 4.7% |
| Afghans | 88.8 /100 | #138 | Excellent 4.7% |
| South Americans | 85.6 /100 | #139 | Excellent 4.7% |
| Canadians | 84.4 /100 | #140 | Excellent 4.7% |
| Basques | 81.8 /100 | #141 | Excellent 4.6% |
| Sudanese | 81.3 /100 | #142 | Excellent 4.6% |
| Hungarians | 80.8 /100 | #143 | Excellent 4.6% |
Demographics Similar to Immigrants from Bangladesh by Professional Degree
In terms of professional degree, the demographic groups most similar to Immigrants from Bangladesh are Immigrants from Zaire (4.5%, a difference of 0.22%), Chinese (4.5%, a difference of 0.39%), Immigrants from Sierra Leone (4.5%, a difference of 0.41%), Immigrants from Afghanistan (4.5%, a difference of 0.48%), and Immigrants from Colombia (4.5%, a difference of 0.51%).
| Demographics | Rating | Rank | Professional Degree |
| Swiss | 61.0 /100 | #164 | Good 4.5% |
| Costa Ricans | 59.9 /100 | #165 | Average 4.5% |
| Immigrants | Colombia | 59.4 /100 | #166 | Average 4.5% |
| Immigrants | Afghanistan | 59.2 /100 | #167 | Average 4.5% |
| Immigrants | Sierra Leone | 58.7 /100 | #168 | Average 4.5% |
| Chinese | 58.6 /100 | #169 | Average 4.5% |
| Immigrants | Zaire | 57.4 /100 | #170 | Average 4.5% |
| Immigrants | Bangladesh | 56.0 /100 | #171 | Average 4.4% |
| Spaniards | 52.0 /100 | #172 | Average 4.4% |
| English | 50.1 /100 | #173 | Average 4.4% |
| Kenyans | 50.0 /100 | #174 | Average 4.4% |
| Irish | 50.0 /100 | #175 | Average 4.4% |
| Immigrants | Peru | 49.3 /100 | #176 | Average 4.4% |
| Celtics | 47.6 /100 | #177 | Average 4.4% |
| Immigrants | Costa Rica | 46.7 /100 | #178 | Average 4.4% |