Australian vs Immigrants from Bangladesh Professional Degree
COMPARE
Australian
Immigrants from Bangladesh
Professional Degree
Professional Degree Comparison
Australians
Immigrants from Bangladesh
5.9%
PROFESSIONAL DEGREE
100.0/ 100
METRIC RATING
47th/ 347
METRIC RANK
4.4%
PROFESSIONAL DEGREE
56.0/ 100
METRIC RATING
171st/ 347
METRIC RANK
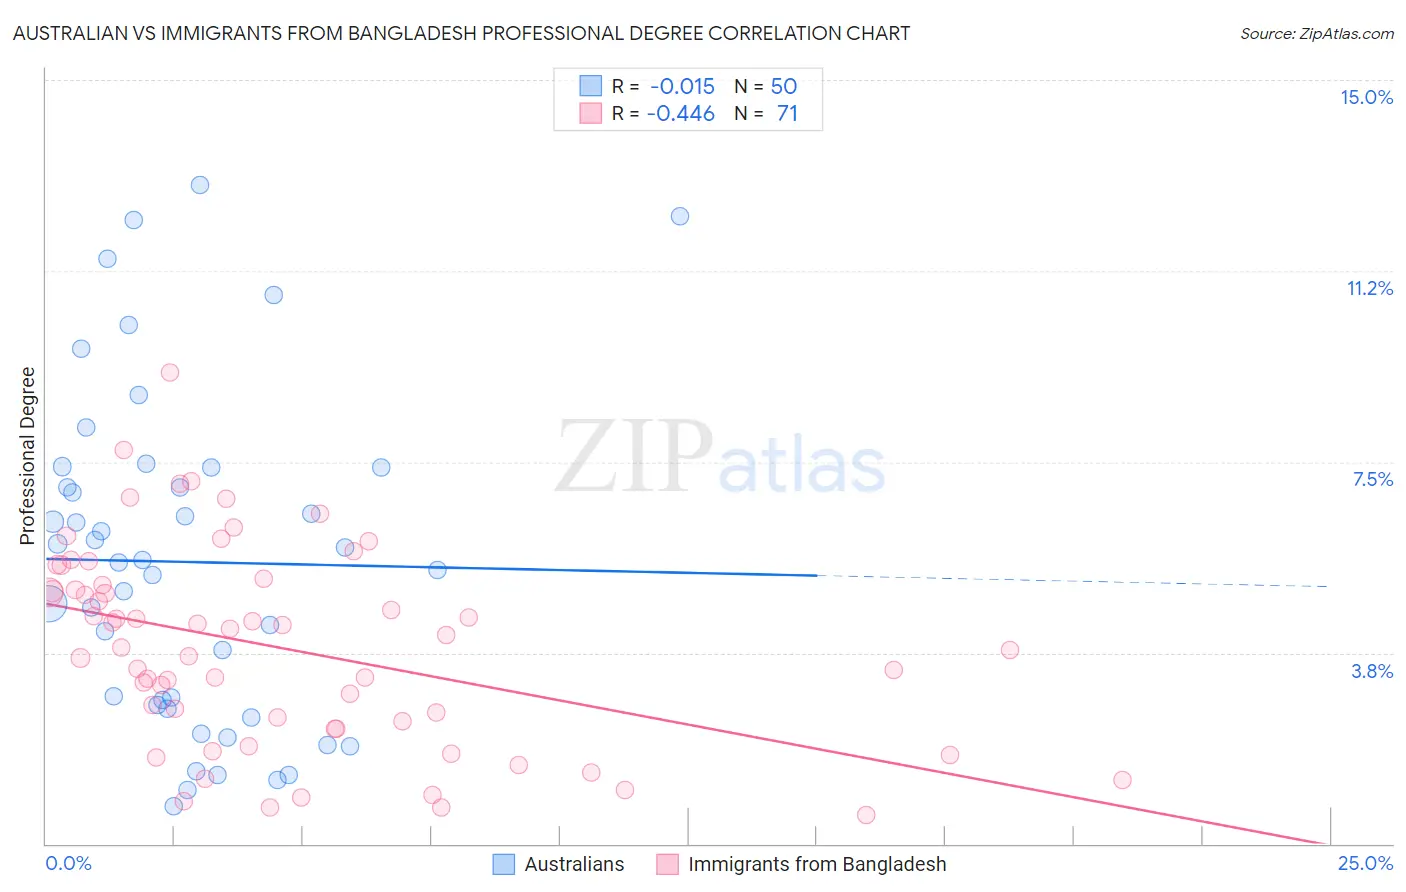
Australian vs Immigrants from Bangladesh Professional Degree Correlation Chart
The statistical analysis conducted on geographies consisting of 223,901,125 people shows no correlation between the proportion of Australians and percentage of population with at least professional degree education in the United States with a correlation coefficient (R) of -0.015 and weighted average of 5.9%. Similarly, the statistical analysis conducted on geographies consisting of 203,559,674 people shows a moderate negative correlation between the proportion of Immigrants from Bangladesh and percentage of population with at least professional degree education in the United States with a correlation coefficient (R) of -0.446 and weighted average of 4.4%, a difference of 32.5%.
Professional Degree Correlation Summary
| Measurement | Australian | Immigrants from Bangladesh |
| Minimum | 0.73% | 0.56% |
| Maximum | 12.9% | 9.3% |
| Range | 12.2% | 8.7% |
| Mean | 5.5% | 3.8% |
| Median | 5.5% | 3.9% |
| Interquartile 25% (IQ1) | 2.7% | 2.3% |
| Interquartile 75% (IQ3) | 7.4% | 5.1% |
| Interquartile Range (IQR) | 4.7% | 2.8% |
| Standard Deviation (Sample) | 3.2% | 1.9% |
| Standard Deviation (Population) | 3.2% | 1.9% |
Similar Demographics by Professional Degree
Demographics Similar to Australians by Professional Degree
In terms of professional degree, the demographic groups most similar to Australians are Immigrants from Argentina (5.9%, a difference of 0.010%), Immigrants from South Central Asia (5.9%, a difference of 0.22%), Paraguayan (5.9%, a difference of 0.42%), Argentinean (5.9%, a difference of 0.66%), and Immigrants from Saudi Arabia (5.9%, a difference of 0.82%).
| Demographics | Rating | Rank | Professional Degree |
| Cambodians | 100.0 /100 | #40 | Exceptional 6.0% |
| New Zealanders | 100.0 /100 | #41 | Exceptional 6.0% |
| Estonians | 100.0 /100 | #42 | Exceptional 6.0% |
| Immigrants | Saudi Arabia | 100.0 /100 | #43 | Exceptional 5.9% |
| Argentineans | 100.0 /100 | #44 | Exceptional 5.9% |
| Immigrants | South Central Asia | 100.0 /100 | #45 | Exceptional 5.9% |
| Immigrants | Argentina | 100.0 /100 | #46 | Exceptional 5.9% |
| Australians | 100.0 /100 | #47 | Exceptional 5.9% |
| Paraguayans | 100.0 /100 | #48 | Exceptional 5.9% |
| Immigrants | Latvia | 100.0 /100 | #49 | Exceptional 5.8% |
| Immigrants | Czechoslovakia | 100.0 /100 | #50 | Exceptional 5.8% |
| Immigrants | Greece | 100.0 /100 | #51 | Exceptional 5.8% |
| Immigrants | Serbia | 100.0 /100 | #52 | Exceptional 5.8% |
| Immigrants | Netherlands | 100.0 /100 | #53 | Exceptional 5.8% |
| Immigrants | Kuwait | 100.0 /100 | #54 | Exceptional 5.7% |
Demographics Similar to Immigrants from Bangladesh by Professional Degree
In terms of professional degree, the demographic groups most similar to Immigrants from Bangladesh are Immigrants from Zaire (4.5%, a difference of 0.22%), Chinese (4.5%, a difference of 0.39%), Immigrants from Sierra Leone (4.5%, a difference of 0.41%), Immigrants from Afghanistan (4.5%, a difference of 0.48%), and Immigrants from Colombia (4.5%, a difference of 0.51%).
| Demographics | Rating | Rank | Professional Degree |
| Swiss | 61.0 /100 | #164 | Good 4.5% |
| Costa Ricans | 59.9 /100 | #165 | Average 4.5% |
| Immigrants | Colombia | 59.4 /100 | #166 | Average 4.5% |
| Immigrants | Afghanistan | 59.2 /100 | #167 | Average 4.5% |
| Immigrants | Sierra Leone | 58.7 /100 | #168 | Average 4.5% |
| Chinese | 58.6 /100 | #169 | Average 4.5% |
| Immigrants | Zaire | 57.4 /100 | #170 | Average 4.5% |
| Immigrants | Bangladesh | 56.0 /100 | #171 | Average 4.4% |
| Spaniards | 52.0 /100 | #172 | Average 4.4% |
| English | 50.1 /100 | #173 | Average 4.4% |
| Kenyans | 50.0 /100 | #174 | Average 4.4% |
| Irish | 50.0 /100 | #175 | Average 4.4% |
| Immigrants | Peru | 49.3 /100 | #176 | Average 4.4% |
| Celtics | 47.6 /100 | #177 | Average 4.4% |
| Immigrants | Costa Rica | 46.7 /100 | #178 | Average 4.4% |