Moroccan vs Immigrants from Bangladesh Male Unemployment
COMPARE
Moroccan
Immigrants from Bangladesh
Male Unemployment
Male Unemployment Comparison
Moroccans
Immigrants from Bangladesh
5.6%
MALE UNEMPLOYMENT
1.6/ 100
METRIC RATING
232nd/ 347
METRIC RANK
6.6%
MALE UNEMPLOYMENT
0.0/ 100
METRIC RATING
299th/ 347
METRIC RANK
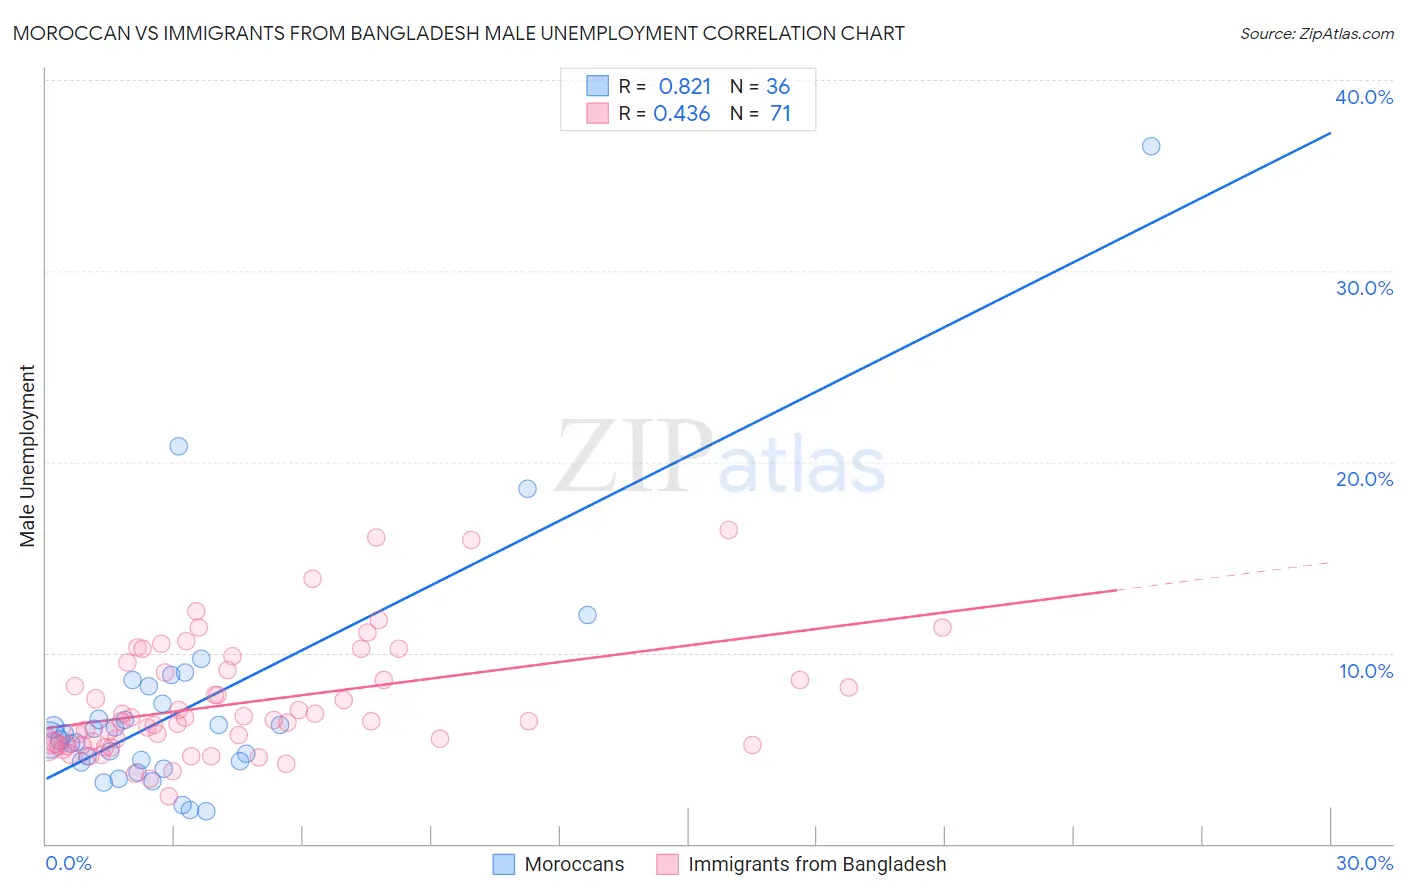
Moroccan vs Immigrants from Bangladesh Male Unemployment Correlation Chart
The statistical analysis conducted on geographies consisting of 201,559,646 people shows a very strong positive correlation between the proportion of Moroccans and unemployment rate among males in the United States with a correlation coefficient (R) of 0.821 and weighted average of 5.6%. Similarly, the statistical analysis conducted on geographies consisting of 203,494,177 people shows a moderate positive correlation between the proportion of Immigrants from Bangladesh and unemployment rate among males in the United States with a correlation coefficient (R) of 0.436 and weighted average of 6.6%, a difference of 17.0%.
Male Unemployment Correlation Summary
| Measurement | Moroccan | Immigrants from Bangladesh |
| Minimum | 1.7% | 2.5% |
| Maximum | 36.5% | 16.4% |
| Range | 34.8% | 13.9% |
| Mean | 7.2% | 7.4% |
| Median | 5.6% | 6.4% |
| Interquartile 25% (IQ1) | 4.3% | 5.2% |
| Interquartile 75% (IQ3) | 7.8% | 9.1% |
| Interquartile Range (IQR) | 3.5% | 3.9% |
| Standard Deviation (Sample) | 6.4% | 3.0% |
| Standard Deviation (Population) | 6.3% | 3.0% |
Similar Demographics by Male Unemployment
Demographics Similar to Moroccans by Male Unemployment
In terms of male unemployment, the demographic groups most similar to Moroccans are Choctaw (5.6%, a difference of 0.030%), Somali (5.6%, a difference of 0.080%), Immigrants from Somalia (5.6%, a difference of 0.080%), Immigrants from Africa (5.6%, a difference of 0.090%), and Immigrants from Honduras (5.6%, a difference of 0.11%).
| Demographics | Rating | Rank | Male Unemployment |
| Panamanians | 1.9 /100 | #225 | Tragic 5.6% |
| Immigrants | Cambodia | 1.8 /100 | #226 | Tragic 5.6% |
| Immigrants | Panama | 1.8 /100 | #227 | Tragic 5.6% |
| Seminole | 1.8 /100 | #228 | Tragic 5.6% |
| Central Americans | 1.8 /100 | #229 | Tragic 5.6% |
| Immigrants | Africa | 1.7 /100 | #230 | Tragic 5.6% |
| Choctaw | 1.6 /100 | #231 | Tragic 5.6% |
| Moroccans | 1.6 /100 | #232 | Tragic 5.6% |
| Somalis | 1.5 /100 | #233 | Tragic 5.6% |
| Immigrants | Somalia | 1.5 /100 | #234 | Tragic 5.6% |
| Immigrants | Honduras | 1.5 /100 | #235 | Tragic 5.6% |
| Guatemalans | 1.2 /100 | #236 | Tragic 5.6% |
| Hondurans | 1.1 /100 | #237 | Tragic 5.6% |
| Native Hawaiians | 1.1 /100 | #238 | Tragic 5.6% |
| Immigrants | Guatemala | 1.1 /100 | #239 | Tragic 5.6% |
Demographics Similar to Immigrants from Bangladesh by Male Unemployment
In terms of male unemployment, the demographic groups most similar to Immigrants from Bangladesh are Jamaican (6.6%, a difference of 0.13%), Chippewa (6.6%, a difference of 0.21%), Vietnamese (6.6%, a difference of 0.27%), Immigrants from Belize (6.6%, a difference of 0.38%), and Immigrants from Haiti (6.5%, a difference of 0.53%).
| Demographics | Rating | Rank | Male Unemployment |
| Nepalese | 0.0 /100 | #292 | Tragic 6.4% |
| Haitians | 0.0 /100 | #293 | Tragic 6.4% |
| Senegalese | 0.0 /100 | #294 | Tragic 6.4% |
| Belizeans | 0.0 /100 | #295 | Tragic 6.5% |
| Immigrants | Haiti | 0.0 /100 | #296 | Tragic 6.5% |
| Chippewa | 0.0 /100 | #297 | Tragic 6.6% |
| Jamaicans | 0.0 /100 | #298 | Tragic 6.6% |
| Immigrants | Bangladesh | 0.0 /100 | #299 | Tragic 6.6% |
| Vietnamese | 0.0 /100 | #300 | Tragic 6.6% |
| Immigrants | Belize | 0.0 /100 | #301 | Tragic 6.6% |
| Ute | 0.0 /100 | #302 | Tragic 6.6% |
| Immigrants | West Indies | 0.0 /100 | #303 | Tragic 6.7% |
| West Indians | 0.0 /100 | #304 | Tragic 6.7% |
| Trinidadians and Tobagonians | 0.0 /100 | #305 | Tragic 6.7% |
| Immigrants | Trinidad and Tobago | 0.0 /100 | #306 | Tragic 6.7% |