Mongolian vs Immigrants from Southern Europe College, Under 1 year
COMPARE
Mongolian
Immigrants from Southern Europe
College, Under 1 year
College, Under 1 year Comparison
Mongolians
Immigrants from Southern Europe
69.9%
COLLEGE, UNDER 1 YEAR
99.8/ 100
METRIC RATING
51st/ 347
METRIC RANK
64.9%
COLLEGE, UNDER 1 YEAR
34.3/ 100
METRIC RATING
187th/ 347
METRIC RANK
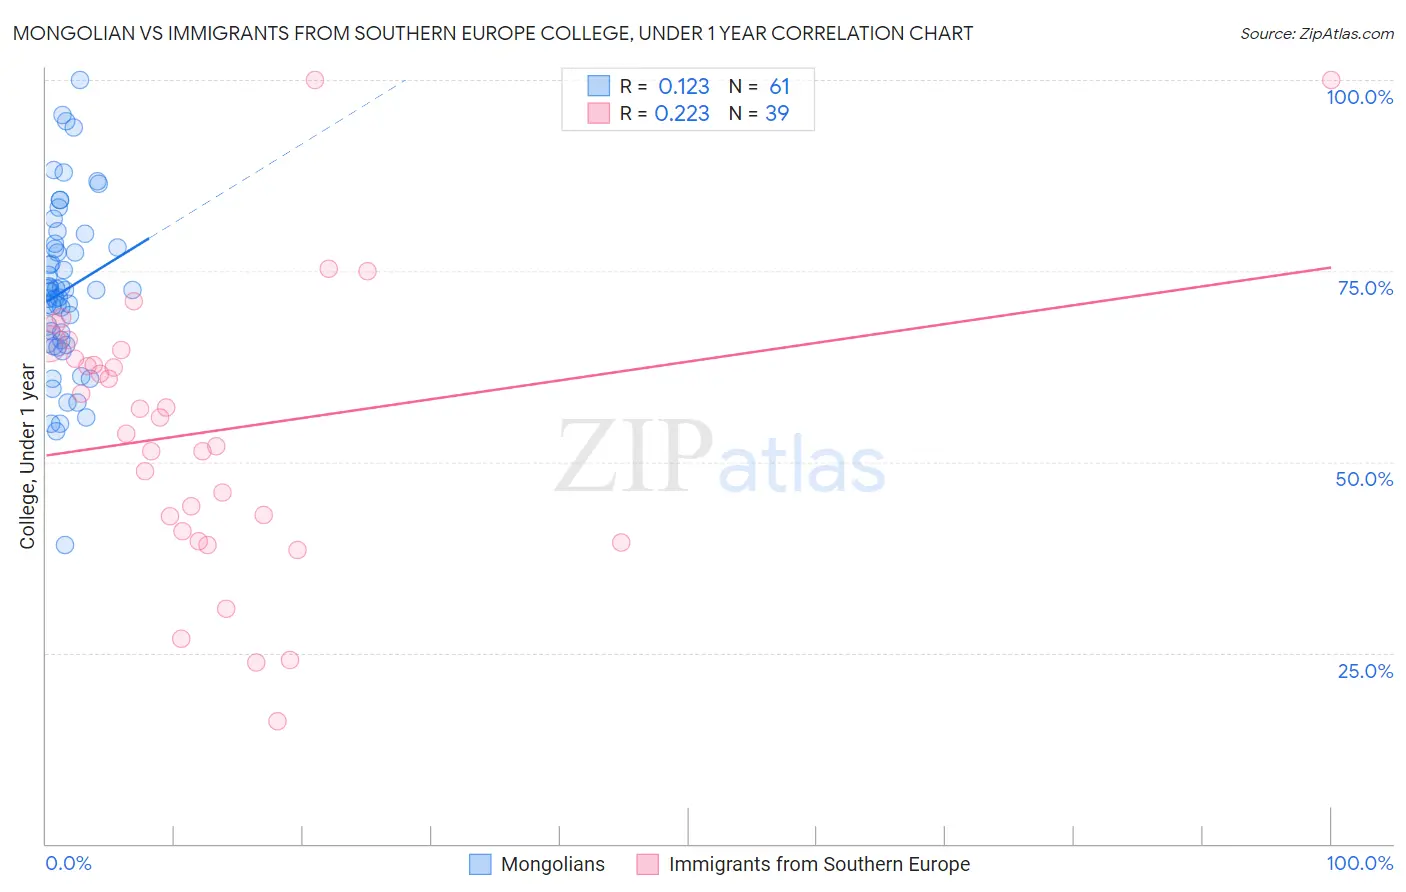
Mongolian vs Immigrants from Southern Europe College, Under 1 year Correlation Chart
The statistical analysis conducted on geographies consisting of 140,362,004 people shows a poor positive correlation between the proportion of Mongolians and percentage of population with at least college, under 1 year education in the United States with a correlation coefficient (R) of 0.123 and weighted average of 69.9%. Similarly, the statistical analysis conducted on geographies consisting of 402,801,573 people shows a weak positive correlation between the proportion of Immigrants from Southern Europe and percentage of population with at least college, under 1 year education in the United States with a correlation coefficient (R) of 0.223 and weighted average of 64.9%, a difference of 7.6%.
College, Under 1 year Correlation Summary
| Measurement | Mongolian | Immigrants from Southern Europe |
| Minimum | 39.1% | 16.1% |
| Maximum | 100.0% | 100.0% |
| Range | 60.9% | 83.9% |
| Mean | 72.4% | 54.1% |
| Median | 72.4% | 55.8% |
| Interquartile 25% (IQ1) | 65.5% | 40.9% |
| Interquartile 75% (IQ3) | 78.3% | 64.6% |
| Interquartile Range (IQR) | 12.8% | 23.6% |
| Standard Deviation (Sample) | 11.3% | 18.3% |
| Standard Deviation (Population) | 11.2% | 18.1% |
Similar Demographics by College, Under 1 year
Demographics Similar to Mongolians by College, Under 1 year
In terms of college, under 1 year, the demographic groups most similar to Mongolians are Immigrants from Russia (69.9%, a difference of 0.020%), Zimbabwean (69.9%, a difference of 0.040%), Immigrants from Austria (70.0%, a difference of 0.15%), Immigrants from Netherlands (70.0%, a difference of 0.20%), and Immigrants from Bulgaria (70.0%, a difference of 0.25%).
| Demographics | Rating | Rank | College, Under 1 year |
| New Zealanders | 99.9 /100 | #44 | Exceptional 70.2% |
| Immigrants | Norway | 99.9 /100 | #45 | Exceptional 70.2% |
| Immigrants | Latvia | 99.9 /100 | #46 | Exceptional 70.1% |
| Immigrants | Bulgaria | 99.8 /100 | #47 | Exceptional 70.0% |
| Immigrants | Netherlands | 99.8 /100 | #48 | Exceptional 70.0% |
| Immigrants | Austria | 99.8 /100 | #49 | Exceptional 70.0% |
| Zimbabweans | 99.8 /100 | #50 | Exceptional 69.9% |
| Mongolians | 99.8 /100 | #51 | Exceptional 69.9% |
| Immigrants | Russia | 99.8 /100 | #52 | Exceptional 69.9% |
| South Africans | 99.7 /100 | #53 | Exceptional 69.7% |
| Immigrants | Czechoslovakia | 99.7 /100 | #54 | Exceptional 69.6% |
| Maltese | 99.7 /100 | #55 | Exceptional 69.5% |
| Immigrants | Scotland | 99.6 /100 | #56 | Exceptional 69.4% |
| Asians | 99.6 /100 | #57 | Exceptional 69.4% |
| Immigrants | Malaysia | 99.6 /100 | #58 | Exceptional 69.3% |
Demographics Similar to Immigrants from Southern Europe by College, Under 1 year
In terms of college, under 1 year, the demographic groups most similar to Immigrants from Southern Europe are Immigrants from Albania (64.9%, a difference of 0.11%), Spanish (64.9%, a difference of 0.14%), Immigrants from Philippines (64.8%, a difference of 0.21%), Immigrants from Sierra Leone (65.1%, a difference of 0.26%), and Immigrants from Armenia (64.7%, a difference of 0.32%).
| Demographics | Rating | Rank | College, Under 1 year |
| Dutch | 46.1 /100 | #180 | Average 65.3% |
| Spaniards | 45.5 /100 | #181 | Average 65.3% |
| Immigrants | Africa | 44.7 /100 | #182 | Average 65.3% |
| Immigrants | Poland | 42.6 /100 | #183 | Average 65.2% |
| Bermudans | 42.0 /100 | #184 | Average 65.2% |
| Sri Lankans | 41.7 /100 | #185 | Average 65.2% |
| Immigrants | Sierra Leone | 39.7 /100 | #186 | Fair 65.1% |
| Immigrants | Southern Europe | 34.3 /100 | #187 | Fair 64.9% |
| Immigrants | Albania | 32.0 /100 | #188 | Fair 64.9% |
| Spanish | 31.6 /100 | #189 | Fair 64.9% |
| Immigrants | Philippines | 30.1 /100 | #190 | Fair 64.8% |
| Immigrants | Armenia | 28.1 /100 | #191 | Fair 64.7% |
| Immigrants | Thailand | 27.0 /100 | #192 | Fair 64.7% |
| Slovaks | 26.7 /100 | #193 | Fair 64.7% |
| Immigrants | Cameroon | 24.6 /100 | #194 | Fair 64.6% |