Mongolian vs Polish 1st Grade
COMPARE
Mongolian
Polish
1st Grade
1st Grade Comparison
Mongolians
Poles
97.9%
1ST GRADE
29.2/ 100
METRIC RATING
194th/ 347
METRIC RANK
98.6%
1ST GRADE
100.0/ 100
METRIC RATING
27th/ 347
METRIC RANK
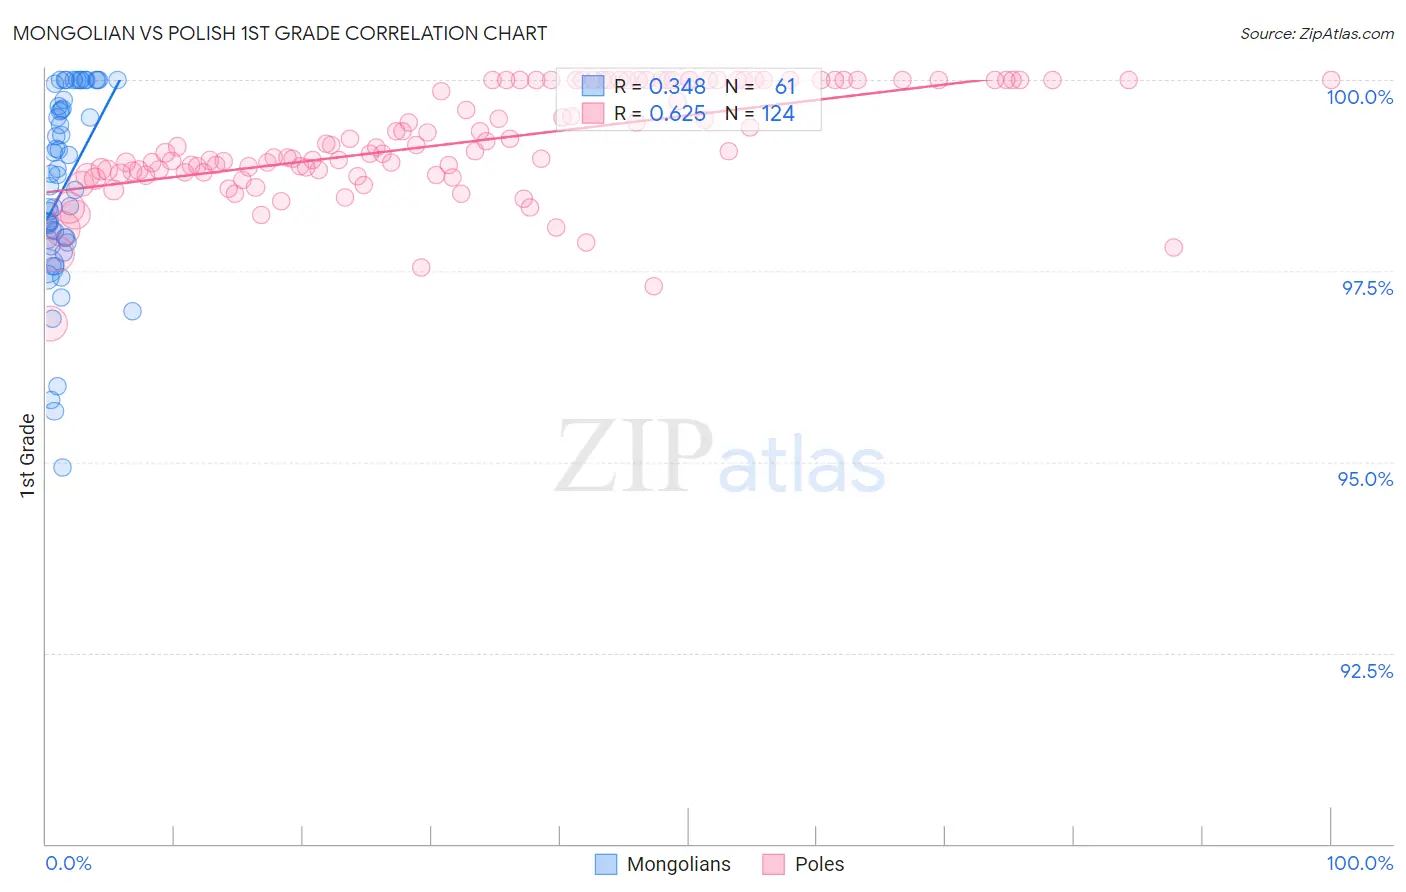
Mongolian vs Polish 1st Grade Correlation Chart
The statistical analysis conducted on geographies consisting of 140,362,004 people shows a mild positive correlation between the proportion of Mongolians and percentage of population with at least 1st grade education in the United States with a correlation coefficient (R) of 0.348 and weighted average of 97.9%. Similarly, the statistical analysis conducted on geographies consisting of 560,594,514 people shows a significant positive correlation between the proportion of Poles and percentage of population with at least 1st grade education in the United States with a correlation coefficient (R) of 0.625 and weighted average of 98.6%, a difference of 0.74%.
1st Grade Correlation Summary
| Measurement | Mongolian | Polish |
| Minimum | 94.9% | 96.8% |
| Maximum | 100.0% | 100.0% |
| Range | 5.1% | 3.2% |
| Mean | 98.6% | 99.2% |
| Median | 98.8% | 99.1% |
| Interquartile 25% (IQ1) | 97.9% | 98.8% |
| Interquartile 75% (IQ3) | 99.7% | 100.0% |
| Interquartile Range (IQR) | 1.8% | 1.2% |
| Standard Deviation (Sample) | 1.2% | 0.69% |
| Standard Deviation (Population) | 1.2% | 0.69% |
Similar Demographics by 1st Grade
Demographics Similar to Mongolians by 1st Grade
In terms of 1st grade, the demographic groups most similar to Mongolians are Paraguayan (97.9%, a difference of 0.0%), Immigrants from Taiwan (97.9%, a difference of 0.0%), Hawaiian (97.9%, a difference of 0.0%), Black/African American (97.9%, a difference of 0.010%), and Immigrants from Kenya (97.8%, a difference of 0.010%).
| Demographics | Rating | Rank | 1st Grade |
| Pakistanis | 35.8 /100 | #187 | Fair 97.9% |
| Arabs | 35.5 /100 | #188 | Fair 97.9% |
| Immigrants | Kazakhstan | 34.9 /100 | #189 | Fair 97.9% |
| Panamanians | 34.1 /100 | #190 | Fair 97.9% |
| Blacks/African Americans | 30.7 /100 | #191 | Fair 97.9% |
| Paraguayans | 30.2 /100 | #192 | Fair 97.9% |
| Immigrants | Taiwan | 29.4 /100 | #193 | Fair 97.9% |
| Mongolians | 29.2 /100 | #194 | Fair 97.9% |
| Hawaiians | 28.8 /100 | #195 | Fair 97.9% |
| Immigrants | Kenya | 26.3 /100 | #196 | Fair 97.8% |
| Guamanians/Chamorros | 26.2 /100 | #197 | Fair 97.8% |
| Yuman | 24.4 /100 | #198 | Fair 97.8% |
| Tohono O'odham | 23.2 /100 | #199 | Fair 97.8% |
| Immigrants | Egypt | 22.6 /100 | #200 | Fair 97.8% |
| Immigrants | Lebanon | 20.1 /100 | #201 | Fair 97.8% |
Demographics Similar to Poles by 1st Grade
In terms of 1st grade, the demographic groups most similar to Poles are Pennsylvania German (98.6%, a difference of 0.0%), Finnish (98.6%, a difference of 0.0%), Lithuanian (98.6%, a difference of 0.0%), Danish (98.6%, a difference of 0.0%), and Scotch-Irish (98.6%, a difference of 0.0%).
| Demographics | Rating | Rank | 1st Grade |
| Sioux | 100.0 /100 | #20 | Exceptional 98.6% |
| Arapaho | 100.0 /100 | #21 | Exceptional 98.6% |
| Pennsylvania Germans | 100.0 /100 | #22 | Exceptional 98.6% |
| Finns | 100.0 /100 | #23 | Exceptional 98.6% |
| Lithuanians | 100.0 /100 | #24 | Exceptional 98.6% |
| Danes | 100.0 /100 | #25 | Exceptional 98.6% |
| Scotch-Irish | 100.0 /100 | #26 | Exceptional 98.6% |
| Poles | 100.0 /100 | #27 | Exceptional 98.6% |
| Croatians | 100.0 /100 | #28 | Exceptional 98.6% |
| French | 100.0 /100 | #29 | Exceptional 98.6% |
| Europeans | 100.0 /100 | #30 | Exceptional 98.5% |
| Czechs | 100.0 /100 | #31 | Exceptional 98.5% |
| French Canadians | 100.0 /100 | #32 | Exceptional 98.5% |
| Scandinavians | 100.0 /100 | #33 | Exceptional 98.5% |
| Swiss | 100.0 /100 | #34 | Exceptional 98.5% |