Mexican vs Immigrants from Kuwait 5th Grade
COMPARE
Mexican
Immigrants from Kuwait
5th Grade
5th Grade Comparison
Mexicans
Immigrants from Kuwait
95.2%
5TH GRADE
0.0/ 100
METRIC RATING
335th/ 347
METRIC RANK
97.6%
5TH GRADE
90.4/ 100
METRIC RATING
132nd/ 347
METRIC RANK
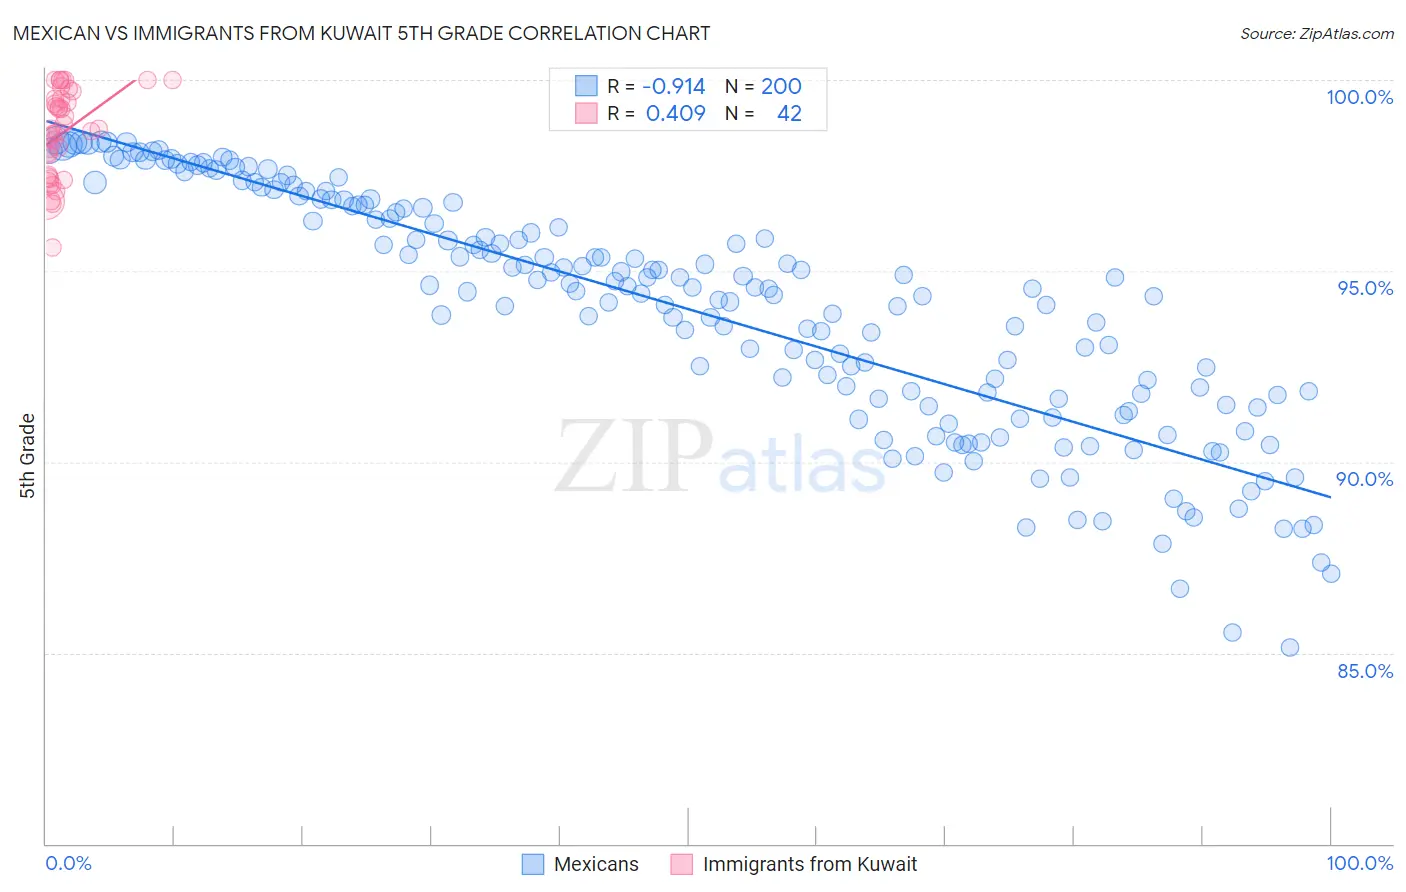
Mexican vs Immigrants from Kuwait 5th Grade Correlation Chart
The statistical analysis conducted on geographies consisting of 565,340,290 people shows a near-perfect negative correlation between the proportion of Mexicans and percentage of population with at least 5th grade education in the United States with a correlation coefficient (R) of -0.914 and weighted average of 95.2%. Similarly, the statistical analysis conducted on geographies consisting of 136,913,666 people shows a moderate positive correlation between the proportion of Immigrants from Kuwait and percentage of population with at least 5th grade education in the United States with a correlation coefficient (R) of 0.409 and weighted average of 97.6%, a difference of 2.5%.
5th Grade Correlation Summary
| Measurement | Mexican | Immigrants from Kuwait |
| Minimum | 85.1% | 95.6% |
| Maximum | 98.4% | 100.0% |
| Range | 13.3% | 4.4% |
| Mean | 94.0% | 98.6% |
| Median | 94.6% | 98.7% |
| Interquartile 25% (IQ1) | 91.7% | 97.5% |
| Interquartile 75% (IQ3) | 96.7% | 99.5% |
| Interquartile Range (IQR) | 5.1% | 2.0% |
| Standard Deviation (Sample) | 3.1% | 1.1% |
| Standard Deviation (Population) | 3.1% | 1.1% |
Similar Demographics by 5th Grade
Demographics Similar to Mexicans by 5th Grade
In terms of 5th grade, the demographic groups most similar to Mexicans are Nepalese (95.2%, a difference of 0.030%), Immigrants from Latin America (95.3%, a difference of 0.050%), Immigrants from Dominican Republic (95.3%, a difference of 0.060%), Immigrants from the Azores (95.1%, a difference of 0.10%), and Immigrants from Honduras (95.4%, a difference of 0.16%).
| Demographics | Rating | Rank | 5th Grade |
| Cape Verdeans | 0.0 /100 | #328 | Tragic 95.5% |
| Mexican American Indians | 0.0 /100 | #329 | Tragic 95.5% |
| Immigrants | Armenia | 0.0 /100 | #330 | Tragic 95.4% |
| Immigrants | Honduras | 0.0 /100 | #331 | Tragic 95.4% |
| Immigrants | Dominican Republic | 0.0 /100 | #332 | Tragic 95.3% |
| Immigrants | Latin America | 0.0 /100 | #333 | Tragic 95.3% |
| Nepalese | 0.0 /100 | #334 | Tragic 95.2% |
| Mexicans | 0.0 /100 | #335 | Tragic 95.2% |
| Immigrants | Azores | 0.0 /100 | #336 | Tragic 95.1% |
| Central Americans | 0.0 /100 | #337 | Tragic 95.1% |
| Immigrants | Cabo Verde | 0.0 /100 | #338 | Tragic 94.9% |
| Immigrants | Yemen | 0.0 /100 | #339 | Tragic 94.9% |
| Guatemalans | 0.0 /100 | #340 | Tragic 94.8% |
| Yakama | 0.0 /100 | #341 | Tragic 94.8% |
| Immigrants | Central America | 0.0 /100 | #342 | Tragic 94.7% |
Demographics Similar to Immigrants from Kuwait by 5th Grade
In terms of 5th grade, the demographic groups most similar to Immigrants from Kuwait are Cambodian (97.6%, a difference of 0.0%), Immigrants from Hungary (97.6%, a difference of 0.0%), Pima (97.6%, a difference of 0.010%), Palestinian (97.5%, a difference of 0.010%), and Immigrants from Serbia (97.6%, a difference of 0.020%).
| Demographics | Rating | Rank | 5th Grade |
| Immigrants | Bulgaria | 93.1 /100 | #125 | Exceptional 97.6% |
| Hmong | 92.3 /100 | #126 | Exceptional 97.6% |
| Immigrants | Serbia | 92.3 /100 | #127 | Exceptional 97.6% |
| Colville | 92.0 /100 | #128 | Exceptional 97.6% |
| Immigrants | Europe | 91.9 /100 | #129 | Exceptional 97.6% |
| Immigrants | Romania | 91.6 /100 | #130 | Exceptional 97.6% |
| Pima | 91.2 /100 | #131 | Exceptional 97.6% |
| Immigrants | Kuwait | 90.4 /100 | #132 | Exceptional 97.6% |
| Cambodians | 90.2 /100 | #133 | Exceptional 97.6% |
| Immigrants | Hungary | 90.1 /100 | #134 | Exceptional 97.6% |
| Palestinians | 89.3 /100 | #135 | Excellent 97.5% |
| Immigrants | Moldova | 87.5 /100 | #136 | Excellent 97.5% |
| Filipinos | 86.8 /100 | #137 | Excellent 97.5% |
| Blackfeet | 86.8 /100 | #138 | Excellent 97.5% |
| Immigrants | Turkey | 86.7 /100 | #139 | Excellent 97.5% |