Mexican vs Native/Alaskan 5th Grade
COMPARE
Mexican
Native/Alaskan
5th Grade
5th Grade Comparison
Mexicans
Natives/Alaskans
95.2%
5TH GRADE
0.0/ 100
METRIC RATING
335th/ 347
METRIC RANK
97.2%
5TH GRADE
18.0/ 100
METRIC RATING
199th/ 347
METRIC RANK
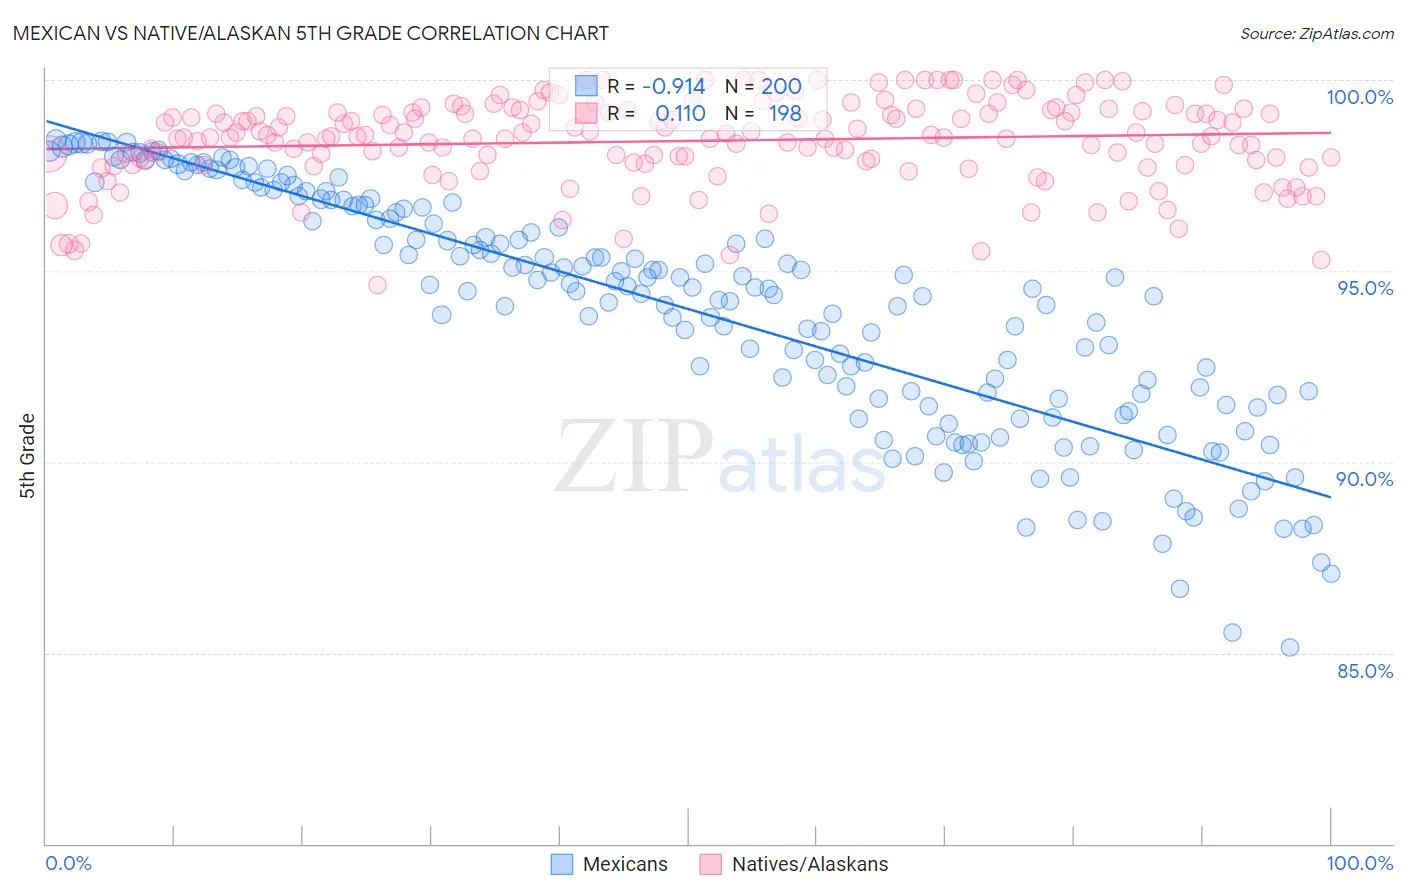
Mexican vs Native/Alaskan 5th Grade Correlation Chart
The statistical analysis conducted on geographies consisting of 565,340,290 people shows a near-perfect negative correlation between the proportion of Mexicans and percentage of population with at least 5th grade education in the United States with a correlation coefficient (R) of -0.914 and weighted average of 95.2%. Similarly, the statistical analysis conducted on geographies consisting of 513,072,444 people shows a poor positive correlation between the proportion of Natives/Alaskans and percentage of population with at least 5th grade education in the United States with a correlation coefficient (R) of 0.110 and weighted average of 97.2%, a difference of 2.1%.
5th Grade Correlation Summary
| Measurement | Mexican | Native/Alaskan |
| Minimum | 85.1% | 94.6% |
| Maximum | 98.4% | 100.0% |
| Range | 13.3% | 5.4% |
| Mean | 94.0% | 98.4% |
| Median | 94.6% | 98.5% |
| Interquartile 25% (IQ1) | 91.7% | 97.8% |
| Interquartile 75% (IQ3) | 96.7% | 99.2% |
| Interquartile Range (IQR) | 5.1% | 1.3% |
| Standard Deviation (Sample) | 3.1% | 1.1% |
| Standard Deviation (Population) | 3.1% | 1.1% |
Similar Demographics by 5th Grade
Demographics Similar to Mexicans by 5th Grade
In terms of 5th grade, the demographic groups most similar to Mexicans are Nepalese (95.2%, a difference of 0.030%), Immigrants from Latin America (95.3%, a difference of 0.050%), Immigrants from Dominican Republic (95.3%, a difference of 0.060%), Immigrants from the Azores (95.1%, a difference of 0.10%), and Immigrants from Honduras (95.4%, a difference of 0.16%).
| Demographics | Rating | Rank | 5th Grade |
| Cape Verdeans | 0.0 /100 | #328 | Tragic 95.5% |
| Mexican American Indians | 0.0 /100 | #329 | Tragic 95.5% |
| Immigrants | Armenia | 0.0 /100 | #330 | Tragic 95.4% |
| Immigrants | Honduras | 0.0 /100 | #331 | Tragic 95.4% |
| Immigrants | Dominican Republic | 0.0 /100 | #332 | Tragic 95.3% |
| Immigrants | Latin America | 0.0 /100 | #333 | Tragic 95.3% |
| Nepalese | 0.0 /100 | #334 | Tragic 95.2% |
| Mexicans | 0.0 /100 | #335 | Tragic 95.2% |
| Immigrants | Azores | 0.0 /100 | #336 | Tragic 95.1% |
| Central Americans | 0.0 /100 | #337 | Tragic 95.1% |
| Immigrants | Cabo Verde | 0.0 /100 | #338 | Tragic 94.9% |
| Immigrants | Yemen | 0.0 /100 | #339 | Tragic 94.9% |
| Guatemalans | 0.0 /100 | #340 | Tragic 94.8% |
| Yakama | 0.0 /100 | #341 | Tragic 94.8% |
| Immigrants | Central America | 0.0 /100 | #342 | Tragic 94.7% |
Demographics Similar to Natives/Alaskans by 5th Grade
In terms of 5th grade, the demographic groups most similar to Natives/Alaskans are Immigrants from Northern Africa (97.2%, a difference of 0.010%), Immigrants from Chile (97.2%, a difference of 0.010%), Immigrants from Uganda (97.2%, a difference of 0.020%), African (97.2%, a difference of 0.020%), and Immigrants from Bahamas (97.2%, a difference of 0.020%).
| Demographics | Rating | Rank | 5th Grade |
| Panamanians | 31.3 /100 | #192 | Fair 97.3% |
| Navajo | 29.0 /100 | #193 | Fair 97.2% |
| Immigrants | Albania | 28.5 /100 | #194 | Fair 97.2% |
| Guamanians/Chamorros | 26.8 /100 | #195 | Fair 97.2% |
| Hawaiians | 25.6 /100 | #196 | Fair 97.2% |
| Brazilians | 25.4 /100 | #197 | Fair 97.2% |
| Immigrants | Uganda | 21.1 /100 | #198 | Fair 97.2% |
| Natives/Alaskans | 18.0 /100 | #199 | Poor 97.2% |
| Immigrants | Northern Africa | 16.8 /100 | #200 | Poor 97.2% |
| Immigrants | Chile | 16.6 /100 | #201 | Poor 97.2% |
| Africans | 15.3 /100 | #202 | Poor 97.2% |
| Immigrants | Bahamas | 14.9 /100 | #203 | Poor 97.2% |
| Immigrants | Zaire | 13.7 /100 | #204 | Poor 97.1% |
| Moroccans | 12.0 /100 | #205 | Poor 97.1% |
| Paiute | 11.6 /100 | #206 | Poor 97.1% |