Immigrants vs Immigrants from Micronesia 5th Grade
COMPARE
Immigrants
Immigrants from Micronesia
5th Grade
5th Grade Comparison
Immigrants
Immigrants from Micronesia
96.2%
5TH GRADE
0.0/ 100
METRIC RATING
299th/ 347
METRIC RANK
97.3%
5TH GRADE
48.8/ 100
METRIC RATING
175th/ 347
METRIC RANK
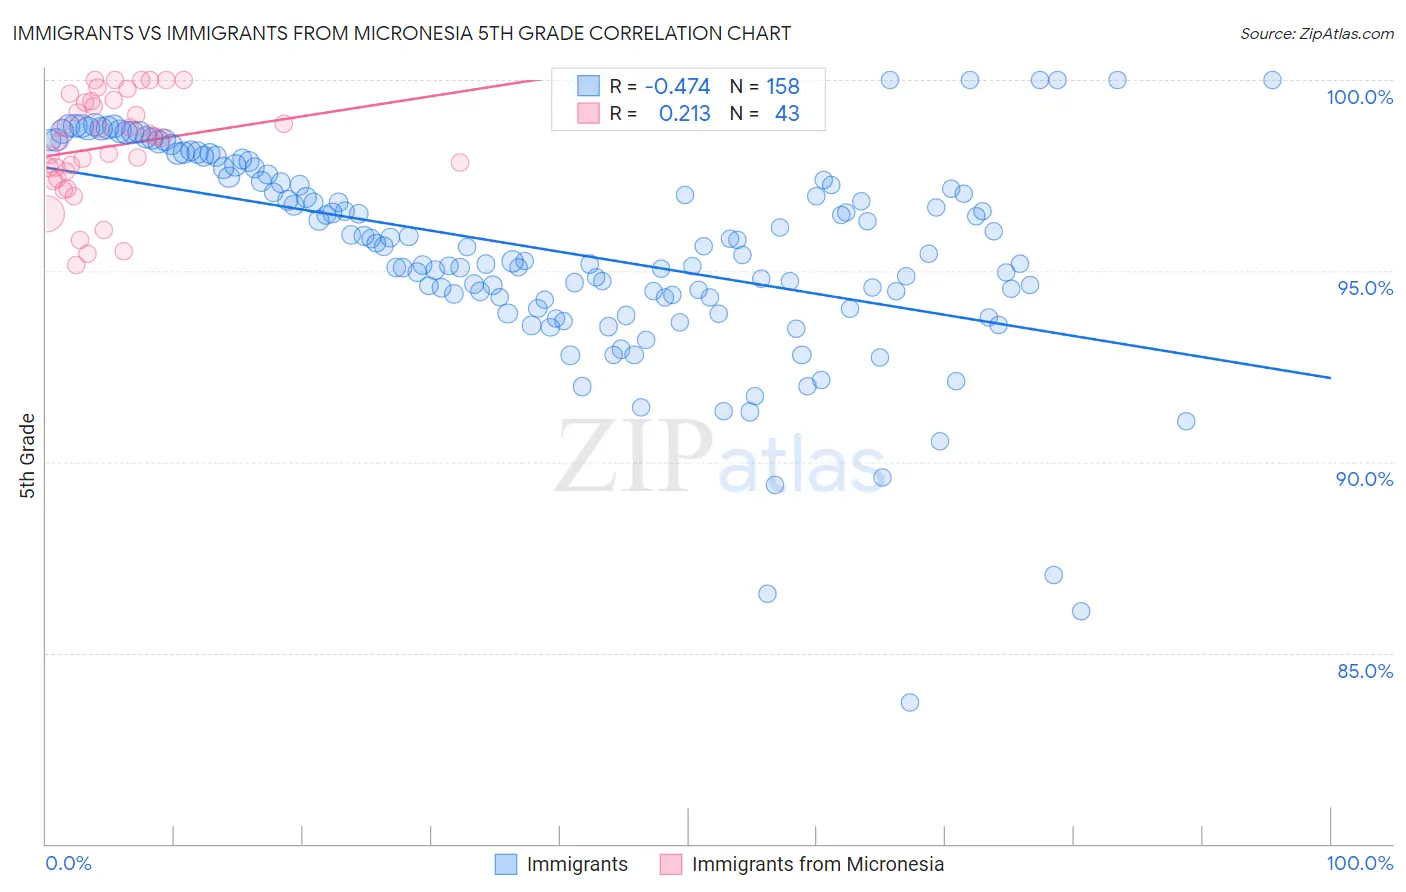
Immigrants vs Immigrants from Micronesia 5th Grade Correlation Chart
The statistical analysis conducted on geographies consisting of 577,786,867 people shows a moderate negative correlation between the proportion of Immigrants and percentage of population with at least 5th grade education in the United States with a correlation coefficient (R) of -0.474 and weighted average of 96.2%. Similarly, the statistical analysis conducted on geographies consisting of 61,604,657 people shows a weak positive correlation between the proportion of Immigrants from Micronesia and percentage of population with at least 5th grade education in the United States with a correlation coefficient (R) of 0.213 and weighted average of 97.3%, a difference of 1.2%.
5th Grade Correlation Summary
| Measurement | Immigrants | Immigrants from Micronesia |
| Minimum | 83.7% | 95.2% |
| Maximum | 100.0% | 100.0% |
| Range | 16.3% | 4.8% |
| Mean | 95.5% | 98.3% |
| Median | 95.6% | 98.5% |
| Interquartile 25% (IQ1) | 94.3% | 97.4% |
| Interquartile 75% (IQ3) | 97.5% | 99.4% |
| Interquartile Range (IQR) | 3.2% | 2.0% |
| Standard Deviation (Sample) | 2.7% | 1.4% |
| Standard Deviation (Population) | 2.7% | 1.4% |
Similar Demographics by 5th Grade
Demographics Similar to Immigrants by 5th Grade
In terms of 5th grade, the demographic groups most similar to Immigrants are Immigrants from Dominica (96.2%, a difference of 0.030%), Sri Lankan (96.1%, a difference of 0.050%), Immigrants from Cuba (96.1%, a difference of 0.070%), Haitian (96.3%, a difference of 0.080%), and Guyanese (96.1%, a difference of 0.080%).
| Demographics | Rating | Rank | 5th Grade |
| Somalis | 0.0 /100 | #292 | Tragic 96.5% |
| Immigrants | Grenada | 0.0 /100 | #293 | Tragic 96.5% |
| Immigrants | Eritrea | 0.0 /100 | #294 | Tragic 96.4% |
| Immigrants | Somalia | 0.0 /100 | #295 | Tragic 96.4% |
| Immigrants | South Eastern Asia | 0.0 /100 | #296 | Tragic 96.3% |
| Haitians | 0.0 /100 | #297 | Tragic 96.3% |
| Immigrants | Dominica | 0.0 /100 | #298 | Tragic 96.2% |
| Immigrants | Immigrants | 0.0 /100 | #299 | Tragic 96.2% |
| Sri Lankans | 0.0 /100 | #300 | Tragic 96.1% |
| Immigrants | Cuba | 0.0 /100 | #301 | Tragic 96.1% |
| Guyanese | 0.0 /100 | #302 | Tragic 96.1% |
| Puerto Ricans | 0.0 /100 | #303 | Tragic 96.1% |
| Immigrants | Burma/Myanmar | 0.0 /100 | #304 | Tragic 96.1% |
| Immigrants | Laos | 0.0 /100 | #305 | Tragic 96.0% |
| Immigrants | Haiti | 0.0 /100 | #306 | Tragic 96.0% |
Demographics Similar to Immigrants from Micronesia by 5th Grade
In terms of 5th grade, the demographic groups most similar to Immigrants from Micronesia are Immigrants from Taiwan (97.3%, a difference of 0.0%), Egyptian (97.3%, a difference of 0.010%), Immigrants from Kazakhstan (97.3%, a difference of 0.010%), Immigrants from Spain (97.3%, a difference of 0.010%), and Chilean (97.3%, a difference of 0.020%).
| Demographics | Rating | Rank | 5th Grade |
| Chileans | 54.5 /100 | #168 | Average 97.3% |
| Immigrants | Korea | 54.1 /100 | #169 | Average 97.3% |
| Venezuelans | 54.0 /100 | #170 | Average 97.3% |
| Immigrants | Sri Lanka | 53.8 /100 | #171 | Average 97.3% |
| Arabs | 53.4 /100 | #172 | Average 97.3% |
| Egyptians | 52.4 /100 | #173 | Average 97.3% |
| Immigrants | Kazakhstan | 50.0 /100 | #174 | Average 97.3% |
| Immigrants | Micronesia | 48.8 /100 | #175 | Average 97.3% |
| Immigrants | Taiwan | 48.4 /100 | #176 | Average 97.3% |
| Immigrants | Spain | 47.0 /100 | #177 | Average 97.3% |
| Comanche | 42.1 /100 | #178 | Average 97.3% |
| Immigrants | Kenya | 40.3 /100 | #179 | Average 97.3% |
| Pakistanis | 40.2 /100 | #180 | Average 97.3% |
| Argentineans | 39.5 /100 | #181 | Fair 97.3% |
| Mongolians | 39.4 /100 | #182 | Fair 97.3% |