Marshallese vs Immigrants from Asia Male Unemployment
COMPARE
Marshallese
Immigrants from Asia
Male Unemployment
Male Unemployment Comparison
Marshallese
Immigrants from Asia
5.7%
MALE UNEMPLOYMENT
0.5/ 100
METRIC RATING
248th/ 347
METRIC RANK
5.1%
MALE UNEMPLOYMENT
89.6/ 100
METRIC RATING
115th/ 347
METRIC RANK
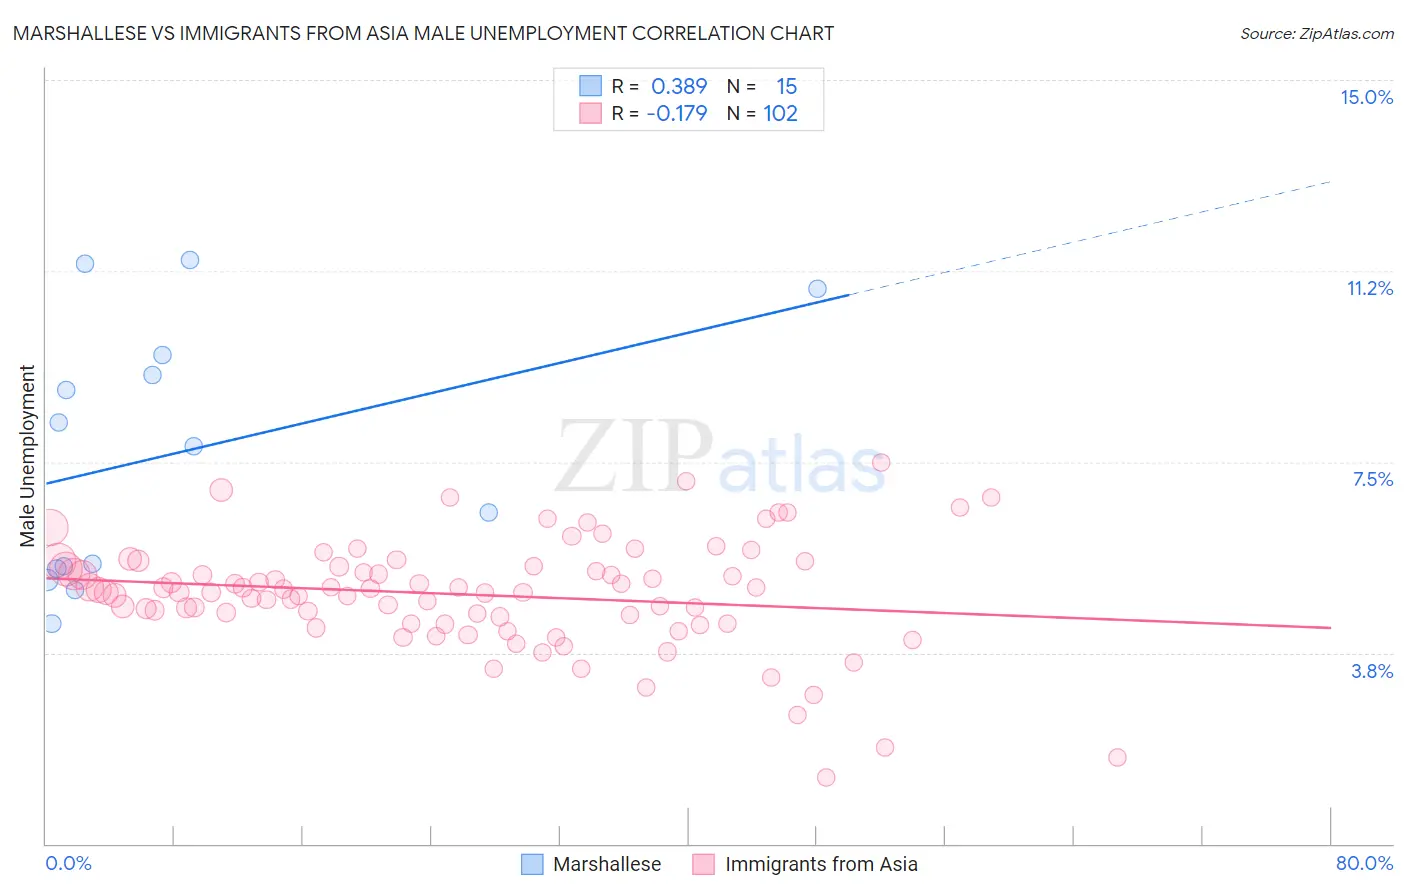
Marshallese vs Immigrants from Asia Male Unemployment Correlation Chart
The statistical analysis conducted on geographies consisting of 14,739,077 people shows a mild positive correlation between the proportion of Marshallese and unemployment rate among males in the United States with a correlation coefficient (R) of 0.389 and weighted average of 5.7%. Similarly, the statistical analysis conducted on geographies consisting of 542,340,626 people shows a poor negative correlation between the proportion of Immigrants from Asia and unemployment rate among males in the United States with a correlation coefficient (R) of -0.179 and weighted average of 5.1%, a difference of 11.4%.
Male Unemployment Correlation Summary
| Measurement | Marshallese | Immigrants from Asia |
| Minimum | 4.3% | 1.3% |
| Maximum | 11.5% | 7.5% |
| Range | 7.1% | 6.2% |
| Mean | 7.7% | 4.9% |
| Median | 7.8% | 5.0% |
| Interquartile 25% (IQ1) | 5.4% | 4.3% |
| Interquartile 75% (IQ3) | 9.6% | 5.4% |
| Interquartile Range (IQR) | 4.2% | 1.1% |
| Standard Deviation (Sample) | 2.5% | 1.1% |
| Standard Deviation (Population) | 2.4% | 1.1% |
Similar Demographics by Male Unemployment
Demographics Similar to Marshallese by Male Unemployment
In terms of male unemployment, the demographic groups most similar to Marshallese are Cree (5.7%, a difference of 0.070%), Immigrants from Bahamas (5.7%, a difference of 0.31%), Hawaiian (5.7%, a difference of 0.32%), Spanish American (5.7%, a difference of 0.36%), and Iroquois (5.7%, a difference of 0.41%).
| Demographics | Rating | Rank | Male Unemployment |
| Salvadorans | 1.0 /100 | #241 | Tragic 5.7% |
| Ottawa | 0.9 /100 | #242 | Tragic 5.7% |
| Bangladeshis | 0.8 /100 | #243 | Tragic 5.7% |
| Immigrants | El Salvador | 0.7 /100 | #244 | Tragic 5.7% |
| Yaqui | 0.7 /100 | #245 | Tragic 5.7% |
| Iroquois | 0.6 /100 | #246 | Tragic 5.7% |
| Hawaiians | 0.6 /100 | #247 | Tragic 5.7% |
| Marshallese | 0.5 /100 | #248 | Tragic 5.7% |
| Cree | 0.4 /100 | #249 | Tragic 5.7% |
| Immigrants | Bahamas | 0.4 /100 | #250 | Tragic 5.7% |
| Spanish Americans | 0.3 /100 | #251 | Tragic 5.7% |
| Mexicans | 0.2 /100 | #252 | Tragic 5.8% |
| Mexican American Indians | 0.2 /100 | #253 | Tragic 5.8% |
| Japanese | 0.2 /100 | #254 | Tragic 5.8% |
| Kiowa | 0.2 /100 | #255 | Tragic 5.8% |
Demographics Similar to Immigrants from Asia by Male Unemployment
In terms of male unemployment, the demographic groups most similar to Immigrants from Asia are Romanian (5.1%, a difference of 0.030%), Immigrants from Denmark (5.1%, a difference of 0.040%), Estonian (5.1%, a difference of 0.090%), Immigrants from Moldova (5.1%, a difference of 0.11%), and Immigrants from Austria (5.1%, a difference of 0.11%).
| Demographics | Rating | Rank | Male Unemployment |
| Immigrants | Nicaragua | 91.2 /100 | #108 | Exceptional 5.1% |
| Immigrants | Pakistan | 90.9 /100 | #109 | Exceptional 5.1% |
| Immigrants | England | 90.8 /100 | #110 | Exceptional 5.1% |
| Immigrants | Eastern Asia | 90.8 /100 | #111 | Exceptional 5.1% |
| Immigrants | Moldova | 90.3 /100 | #112 | Exceptional 5.1% |
| Immigrants | Austria | 90.3 /100 | #113 | Exceptional 5.1% |
| Romanians | 89.8 /100 | #114 | Excellent 5.1% |
| Immigrants | Asia | 89.6 /100 | #115 | Excellent 5.1% |
| Immigrants | Denmark | 89.4 /100 | #116 | Excellent 5.1% |
| Estonians | 89.0 /100 | #117 | Excellent 5.1% |
| Cypriots | 88.8 /100 | #118 | Excellent 5.1% |
| French Canadians | 88.6 /100 | #119 | Excellent 5.1% |
| Ukrainians | 88.4 /100 | #120 | Excellent 5.1% |
| Mongolians | 88.4 /100 | #121 | Excellent 5.1% |
| Nicaraguans | 88.2 /100 | #122 | Excellent 5.1% |