Immigrants from Guatemala vs Comanche College, Under 1 year
COMPARE
Immigrants from Guatemala
Comanche
College, Under 1 year
College, Under 1 year Comparison
Immigrants from Guatemala
Comanche
56.2%
COLLEGE, UNDER 1 YEAR
0.0/ 100
METRIC RATING
327th/ 347
METRIC RANK
61.4%
COLLEGE, UNDER 1 YEAR
0.4/ 100
METRIC RATING
255th/ 347
METRIC RANK
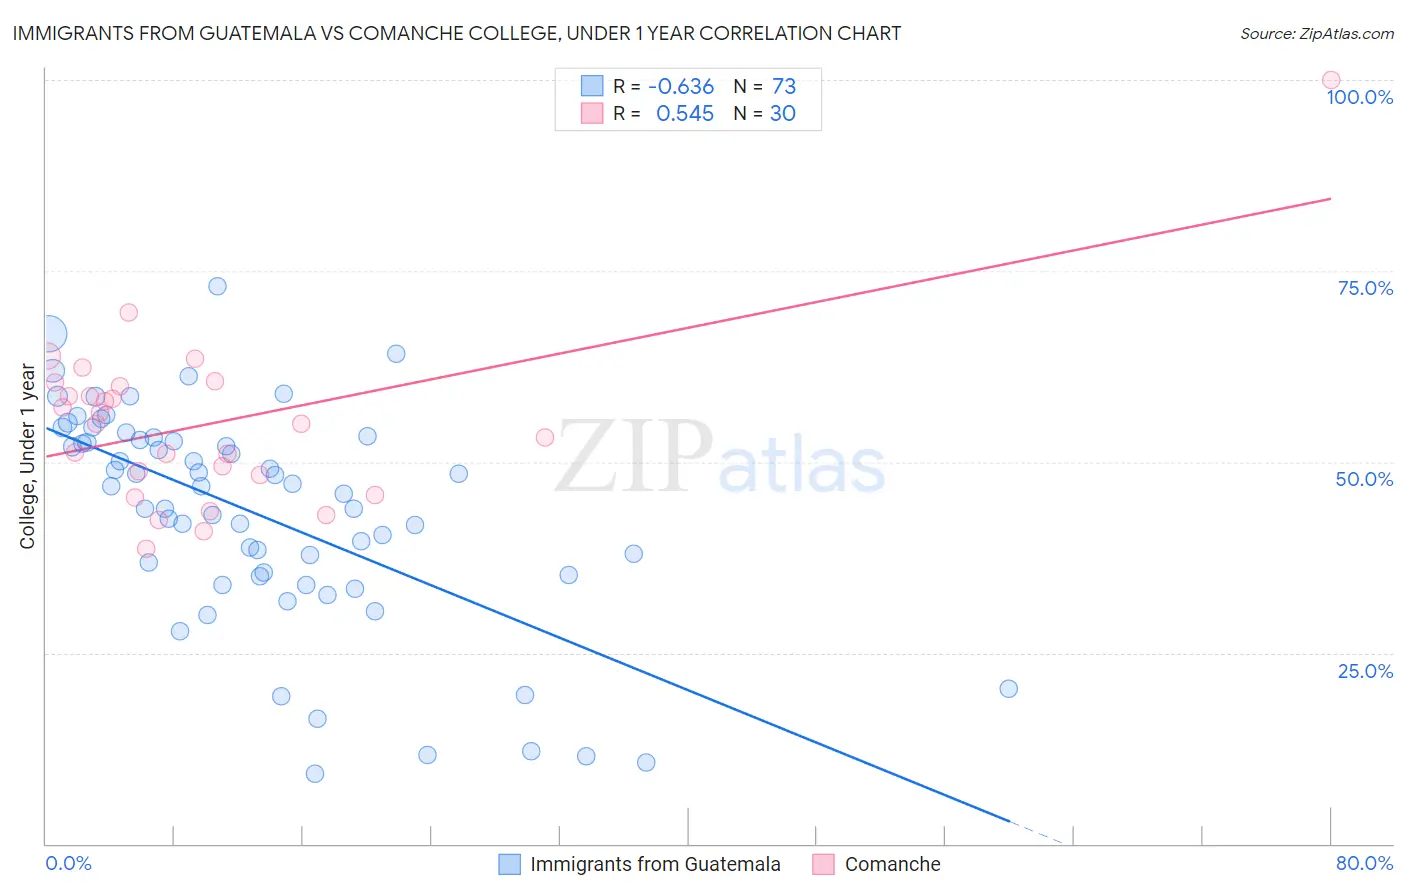
Immigrants from Guatemala vs Comanche College, Under 1 year Correlation Chart
The statistical analysis conducted on geographies consisting of 377,285,561 people shows a significant negative correlation between the proportion of Immigrants from Guatemala and percentage of population with at least college, under 1 year education in the United States with a correlation coefficient (R) of -0.636 and weighted average of 56.2%. Similarly, the statistical analysis conducted on geographies consisting of 109,786,512 people shows a substantial positive correlation between the proportion of Comanche and percentage of population with at least college, under 1 year education in the United States with a correlation coefficient (R) of 0.545 and weighted average of 61.4%, a difference of 9.2%.
College, Under 1 year Correlation Summary
| Measurement | Immigrants from Guatemala | Comanche |
| Minimum | 9.2% | 38.6% |
| Maximum | 73.0% | 100.0% |
| Range | 63.8% | 61.4% |
| Mean | 43.2% | 55.0% |
| Median | 46.8% | 54.9% |
| Interquartile 25% (IQ1) | 35.1% | 48.4% |
| Interquartile 75% (IQ3) | 53.1% | 60.0% |
| Interquartile Range (IQR) | 18.0% | 11.6% |
| Standard Deviation (Sample) | 14.3% | 11.5% |
| Standard Deviation (Population) | 14.2% | 11.3% |
Similar Demographics by College, Under 1 year
Demographics Similar to Immigrants from Guatemala by College, Under 1 year
In terms of college, under 1 year, the demographic groups most similar to Immigrants from Guatemala are Navajo (56.3%, a difference of 0.090%), Immigrants from Latin America (56.3%, a difference of 0.24%), Cape Verdean (56.0%, a difference of 0.29%), Immigrants from El Salvador (56.4%, a difference of 0.34%), and Immigrants from Honduras (56.5%, a difference of 0.47%).
| Demographics | Rating | Rank | College, Under 1 year |
| Guatemalans | 0.0 /100 | #320 | Tragic 56.8% |
| Natives/Alaskans | 0.0 /100 | #321 | Tragic 56.6% |
| Immigrants | Caribbean | 0.0 /100 | #322 | Tragic 56.6% |
| Immigrants | Honduras | 0.0 /100 | #323 | Tragic 56.5% |
| Immigrants | El Salvador | 0.0 /100 | #324 | Tragic 56.4% |
| Immigrants | Latin America | 0.0 /100 | #325 | Tragic 56.3% |
| Navajo | 0.0 /100 | #326 | Tragic 56.3% |
| Immigrants | Guatemala | 0.0 /100 | #327 | Tragic 56.2% |
| Cape Verdeans | 0.0 /100 | #328 | Tragic 56.0% |
| Immigrants | Cuba | 0.0 /100 | #329 | Tragic 55.7% |
| Mexicans | 0.0 /100 | #330 | Tragic 55.6% |
| Dominicans | 0.0 /100 | #331 | Tragic 55.5% |
| Immigrants | Yemen | 0.0 /100 | #332 | Tragic 55.3% |
| Yuman | 0.0 /100 | #333 | Tragic 55.1% |
| Immigrants | Azores | 0.0 /100 | #334 | Tragic 54.7% |
Demographics Similar to Comanche by College, Under 1 year
In terms of college, under 1 year, the demographic groups most similar to Comanche are Bangladeshi (61.4%, a difference of 0.040%), Immigrants from Cambodia (61.5%, a difference of 0.12%), West Indian (61.5%, a difference of 0.13%), Japanese (61.5%, a difference of 0.13%), and Immigrants from Laos (61.3%, a difference of 0.16%).
| Demographics | Rating | Rank | College, Under 1 year |
| Potawatomi | 0.6 /100 | #248 | Tragic 61.8% |
| Vietnamese | 0.5 /100 | #249 | Tragic 61.7% |
| Immigrants | Congo | 0.5 /100 | #250 | Tragic 61.7% |
| Immigrants | Micronesia | 0.5 /100 | #251 | Tragic 61.5% |
| West Indians | 0.4 /100 | #252 | Tragic 61.5% |
| Japanese | 0.4 /100 | #253 | Tragic 61.5% |
| Immigrants | Cambodia | 0.4 /100 | #254 | Tragic 61.5% |
| Comanche | 0.4 /100 | #255 | Tragic 61.4% |
| Bangladeshis | 0.4 /100 | #256 | Tragic 61.4% |
| Immigrants | Laos | 0.3 /100 | #257 | Tragic 61.3% |
| Immigrants | Bangladesh | 0.3 /100 | #258 | Tragic 61.3% |
| Indonesians | 0.3 /100 | #259 | Tragic 61.2% |
| Blackfeet | 0.3 /100 | #260 | Tragic 61.1% |
| Africans | 0.3 /100 | #261 | Tragic 61.1% |
| Barbadians | 0.2 /100 | #262 | Tragic 61.1% |