Colombian vs Comanche College, Under 1 year
COMPARE
Colombian
Comanche
College, Under 1 year
College, Under 1 year Comparison
Colombians
Comanche
64.0%
COLLEGE, UNDER 1 YEAR
12.4/ 100
METRIC RATING
207th/ 347
METRIC RANK
61.4%
COLLEGE, UNDER 1 YEAR
0.4/ 100
METRIC RATING
255th/ 347
METRIC RANK
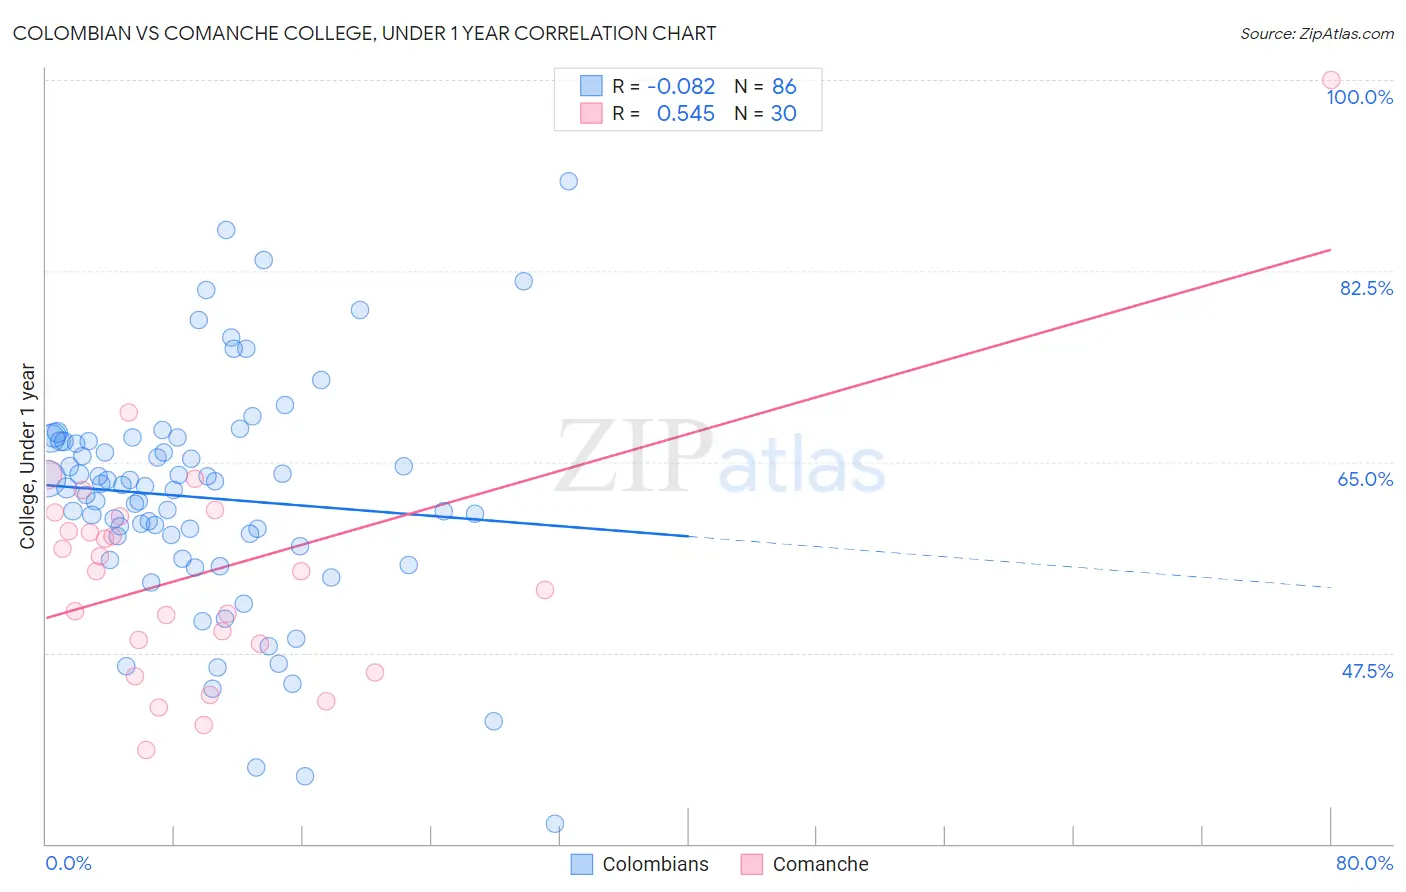
Colombian vs Comanche College, Under 1 year Correlation Chart
The statistical analysis conducted on geographies consisting of 419,699,674 people shows a slight negative correlation between the proportion of Colombians and percentage of population with at least college, under 1 year education in the United States with a correlation coefficient (R) of -0.082 and weighted average of 64.0%. Similarly, the statistical analysis conducted on geographies consisting of 109,786,512 people shows a substantial positive correlation between the proportion of Comanche and percentage of population with at least college, under 1 year education in the United States with a correlation coefficient (R) of 0.545 and weighted average of 61.4%, a difference of 4.3%.
College, Under 1 year Correlation Summary
| Measurement | Colombian | Comanche |
| Minimum | 31.8% | 38.6% |
| Maximum | 90.7% | 100.0% |
| Range | 58.9% | 61.4% |
| Mean | 61.7% | 55.0% |
| Median | 62.7% | 54.9% |
| Interquartile 25% (IQ1) | 57.3% | 48.4% |
| Interquartile 75% (IQ3) | 66.9% | 60.0% |
| Interquartile Range (IQR) | 9.6% | 11.6% |
| Standard Deviation (Sample) | 10.6% | 11.5% |
| Standard Deviation (Population) | 10.5% | 11.3% |
Similar Demographics by College, Under 1 year
Demographics Similar to Colombians by College, Under 1 year
In terms of college, under 1 year, the demographic groups most similar to Colombians are Immigrants from Vietnam (64.0%, a difference of 0.030%), White/Caucasian (64.0%, a difference of 0.040%), Puget Sound Salish (63.9%, a difference of 0.12%), Peruvian (64.1%, a difference of 0.13%), and Ghanaian (63.9%, a difference of 0.13%).
| Demographics | Rating | Rank | College, Under 1 year |
| Nigerians | 16.7 /100 | #200 | Poor 64.3% |
| French Canadians | 16.3 /100 | #201 | Poor 64.2% |
| South Americans | 16.2 /100 | #202 | Poor 64.2% |
| Uruguayans | 15.6 /100 | #203 | Poor 64.2% |
| Immigrants | Zaire | 14.6 /100 | #204 | Poor 64.1% |
| Peruvians | 13.7 /100 | #205 | Poor 64.1% |
| Whites/Caucasians | 12.8 /100 | #206 | Poor 64.0% |
| Colombians | 12.4 /100 | #207 | Poor 64.0% |
| Immigrants | Vietnam | 12.1 /100 | #208 | Poor 64.0% |
| Puget Sound Salish | 11.3 /100 | #209 | Poor 63.9% |
| Ghanaians | 11.2 /100 | #210 | Poor 63.9% |
| Native Hawaiians | 10.6 /100 | #211 | Poor 63.9% |
| Immigrants | Middle Africa | 10.5 /100 | #212 | Poor 63.9% |
| Immigrants | South America | 9.1 /100 | #213 | Tragic 63.8% |
| Immigrants | Nigeria | 8.8 /100 | #214 | Tragic 63.7% |
Demographics Similar to Comanche by College, Under 1 year
In terms of college, under 1 year, the demographic groups most similar to Comanche are Bangladeshi (61.4%, a difference of 0.040%), Immigrants from Cambodia (61.5%, a difference of 0.12%), West Indian (61.5%, a difference of 0.13%), Japanese (61.5%, a difference of 0.13%), and Immigrants from Laos (61.3%, a difference of 0.16%).
| Demographics | Rating | Rank | College, Under 1 year |
| Potawatomi | 0.6 /100 | #248 | Tragic 61.8% |
| Vietnamese | 0.5 /100 | #249 | Tragic 61.7% |
| Immigrants | Congo | 0.5 /100 | #250 | Tragic 61.7% |
| Immigrants | Micronesia | 0.5 /100 | #251 | Tragic 61.5% |
| West Indians | 0.4 /100 | #252 | Tragic 61.5% |
| Japanese | 0.4 /100 | #253 | Tragic 61.5% |
| Immigrants | Cambodia | 0.4 /100 | #254 | Tragic 61.5% |
| Comanche | 0.4 /100 | #255 | Tragic 61.4% |
| Bangladeshis | 0.4 /100 | #256 | Tragic 61.4% |
| Immigrants | Laos | 0.3 /100 | #257 | Tragic 61.3% |
| Immigrants | Bangladesh | 0.3 /100 | #258 | Tragic 61.3% |
| Indonesians | 0.3 /100 | #259 | Tragic 61.2% |
| Blackfeet | 0.3 /100 | #260 | Tragic 61.1% |
| Africans | 0.3 /100 | #261 | Tragic 61.1% |
| Barbadians | 0.2 /100 | #262 | Tragic 61.1% |