Greek vs Pueblo Associate's Degree
COMPARE
Greek
Pueblo
Associate's Degree
Associate's Degree Comparison
Greeks
Pueblo
50.3%
ASSOCIATE'S DEGREE
98.9/ 100
METRIC RATING
82nd/ 347
METRIC RANK
34.0%
ASSOCIATE'S DEGREE
0.0/ 100
METRIC RATING
338th/ 347
METRIC RANK
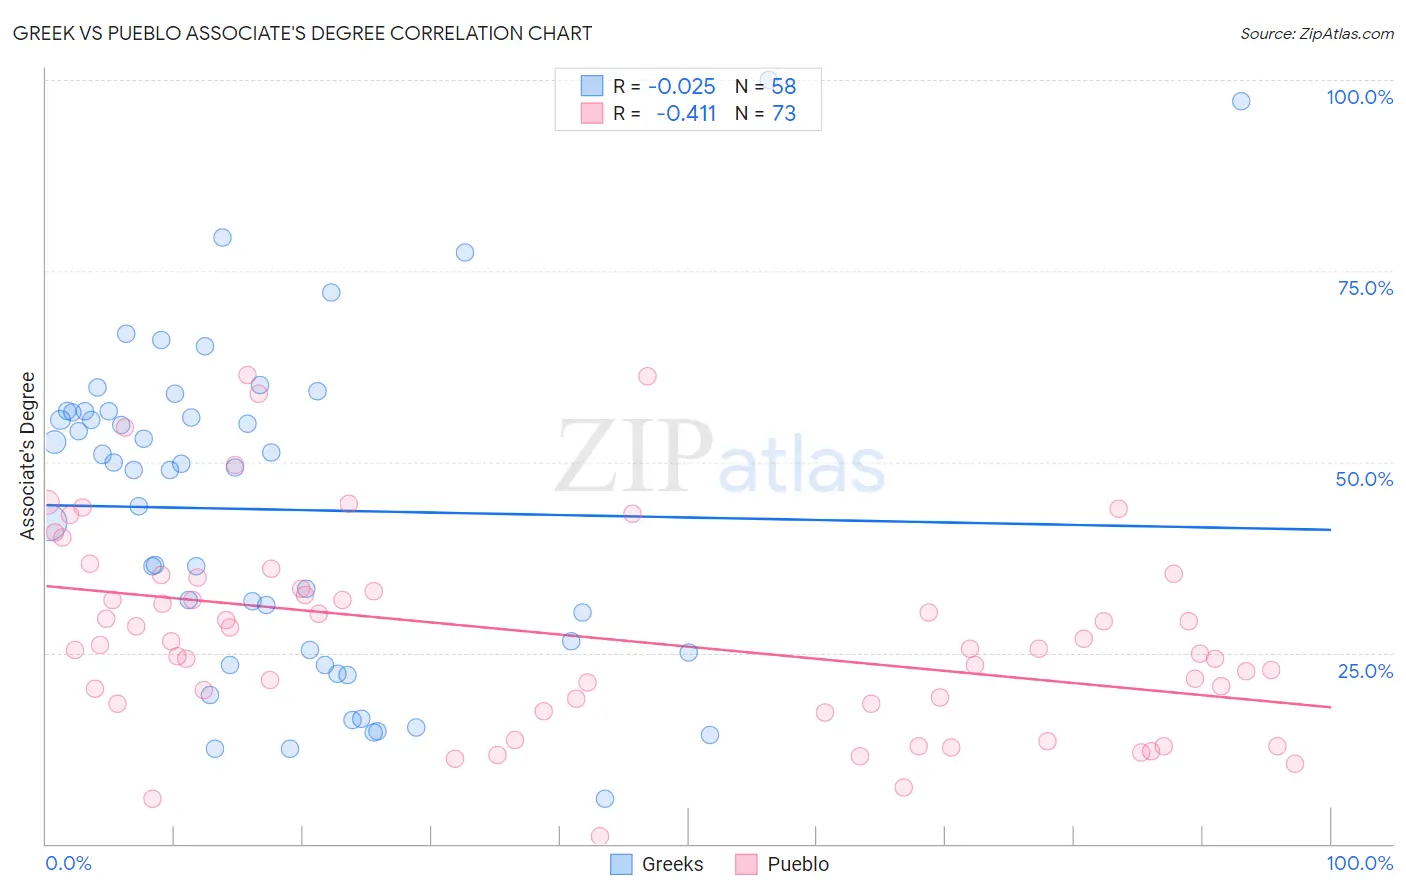
Greek vs Pueblo Associate's Degree Correlation Chart
The statistical analysis conducted on geographies consisting of 482,724,257 people shows no correlation between the proportion of Greeks and percentage of population with at least associate's degree education in the United States with a correlation coefficient (R) of -0.025 and weighted average of 50.3%. Similarly, the statistical analysis conducted on geographies consisting of 120,085,787 people shows a moderate negative correlation between the proportion of Pueblo and percentage of population with at least associate's degree education in the United States with a correlation coefficient (R) of -0.411 and weighted average of 34.0%, a difference of 48.0%.
Associate's Degree Correlation Summary
| Measurement | Greek | Pueblo |
| Minimum | 5.9% | 1.1% |
| Maximum | 100.0% | 61.3% |
| Range | 94.1% | 60.3% |
| Mean | 43.8% | 27.2% |
| Median | 49.2% | 25.6% |
| Interquartile 25% (IQ1) | 25.0% | 18.3% |
| Interquartile 75% (IQ3) | 56.6% | 34.1% |
| Interquartile Range (IQR) | 31.6% | 15.8% |
| Standard Deviation (Sample) | 21.4% | 13.0% |
| Standard Deviation (Population) | 21.2% | 13.0% |
Similar Demographics by Associate's Degree
Demographics Similar to Greeks by Associate's Degree
In terms of associate's degree, the demographic groups most similar to Greeks are Immigrants from Uzbekistan (50.3%, a difference of 0.040%), Immigrants from Hungary (50.2%, a difference of 0.060%), Immigrants from Egypt (50.2%, a difference of 0.11%), Immigrants from Croatia (50.2%, a difference of 0.12%), and Maltese (50.4%, a difference of 0.23%).
| Demographics | Rating | Rank | Associate's Degree |
| Immigrants | Scotland | 99.3 /100 | #75 | Exceptional 50.6% |
| Immigrants | Zimbabwe | 99.2 /100 | #76 | Exceptional 50.5% |
| Immigrants | Lebanon | 99.1 /100 | #77 | Exceptional 50.5% |
| Immigrants | Eastern Europe | 99.1 /100 | #78 | Exceptional 50.5% |
| Ethiopians | 99.1 /100 | #79 | Exceptional 50.4% |
| Armenians | 99.1 /100 | #80 | Exceptional 50.4% |
| Maltese | 99.1 /100 | #81 | Exceptional 50.4% |
| Greeks | 98.9 /100 | #82 | Exceptional 50.3% |
| Immigrants | Uzbekistan | 98.9 /100 | #83 | Exceptional 50.3% |
| Immigrants | Hungary | 98.9 /100 | #84 | Exceptional 50.2% |
| Immigrants | Egypt | 98.9 /100 | #85 | Exceptional 50.2% |
| Immigrants | Croatia | 98.9 /100 | #86 | Exceptional 50.2% |
| Immigrants | Moldova | 98.8 /100 | #87 | Exceptional 50.2% |
| Immigrants | Canada | 98.7 /100 | #88 | Exceptional 50.1% |
| Immigrants | Western Europe | 98.7 /100 | #89 | Exceptional 50.1% |
Demographics Similar to Pueblo by Associate's Degree
In terms of associate's degree, the demographic groups most similar to Pueblo are Lumbee (34.1%, a difference of 0.41%), Immigrants from Mexico (33.7%, a difference of 0.71%), Hopi (34.6%, a difference of 1.7%), Spanish American Indian (34.9%, a difference of 2.6%), and Native/Alaskan (34.9%, a difference of 2.8%).
| Demographics | Rating | Rank | Associate's Degree |
| Immigrants | Azores | 0.0 /100 | #331 | Tragic 35.6% |
| Immigrants | Central America | 0.0 /100 | #332 | Tragic 35.0% |
| Mexicans | 0.0 /100 | #333 | Tragic 35.0% |
| Natives/Alaskans | 0.0 /100 | #334 | Tragic 34.9% |
| Spanish American Indians | 0.0 /100 | #335 | Tragic 34.9% |
| Hopi | 0.0 /100 | #336 | Tragic 34.6% |
| Lumbee | 0.0 /100 | #337 | Tragic 34.1% |
| Pueblo | 0.0 /100 | #338 | Tragic 34.0% |
| Immigrants | Mexico | 0.0 /100 | #339 | Tragic 33.7% |
| Navajo | 0.0 /100 | #340 | Tragic 32.6% |
| Inupiat | 0.0 /100 | #341 | Tragic 32.6% |
| Yakama | 0.0 /100 | #342 | Tragic 32.3% |
| Tohono O'odham | 0.0 /100 | #343 | Tragic 31.8% |
| Yuman | 0.0 /100 | #344 | Tragic 31.3% |
| Pima | 0.0 /100 | #345 | Tragic 30.2% |