Maltese vs Pueblo Median Female Earnings
COMPARE
Maltese
Pueblo
Median Female Earnings
Median Female Earnings Comparison
Maltese
Pueblo
$43,357
MEDIAN FEMALE EARNINGS
100.0/ 100
METRIC RATING
51st/ 347
METRIC RANK
$32,564
MEDIAN FEMALE EARNINGS
0.0/ 100
METRIC RATING
343rd/ 347
METRIC RANK
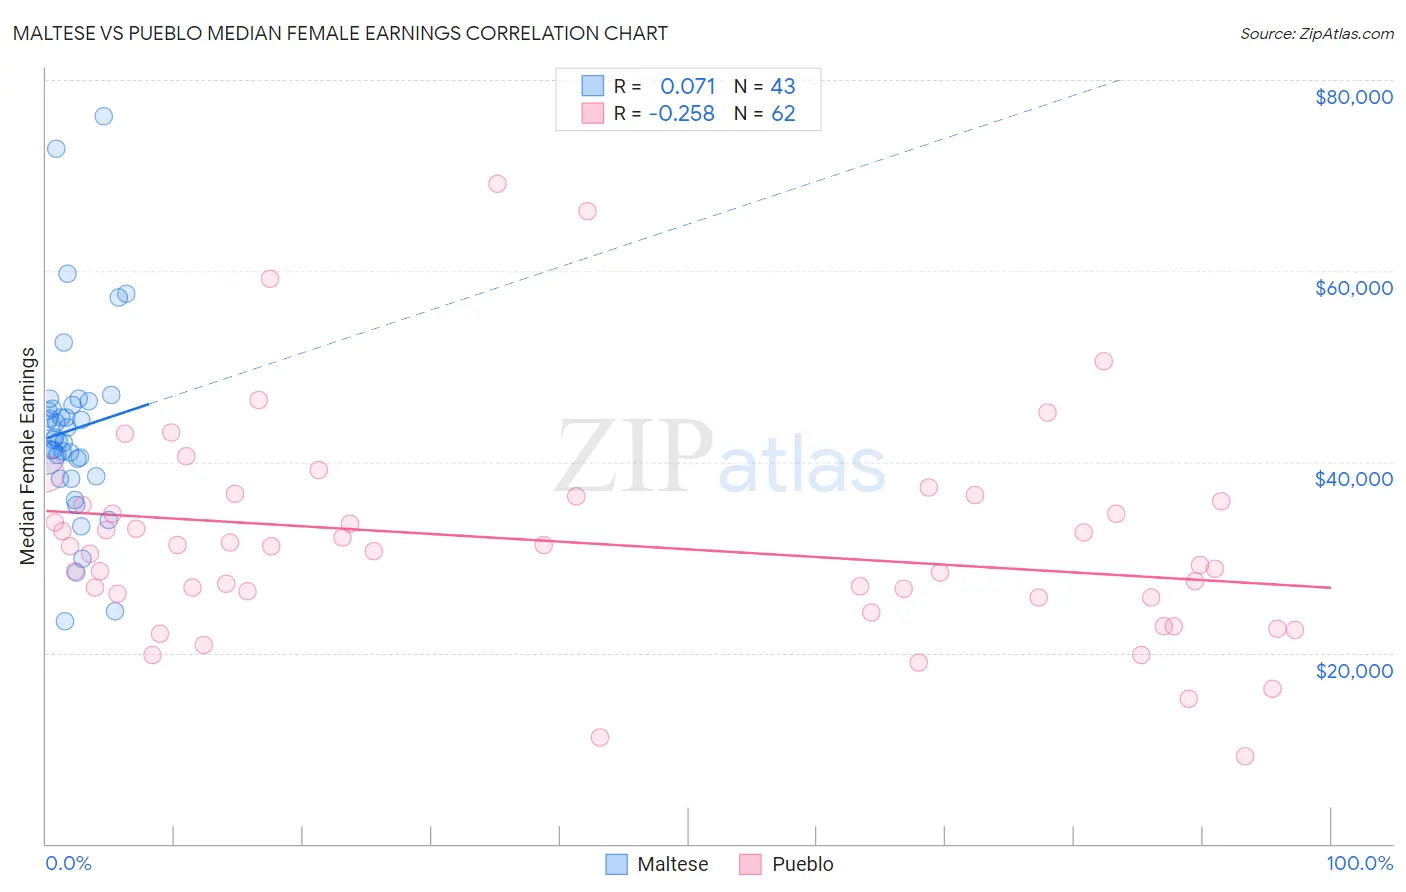
Maltese vs Pueblo Median Female Earnings Correlation Chart
The statistical analysis conducted on geographies consisting of 126,447,525 people shows a slight positive correlation between the proportion of Maltese and median female earnings in the United States with a correlation coefficient (R) of 0.071 and weighted average of $43,357. Similarly, the statistical analysis conducted on geographies consisting of 120,036,612 people shows a weak negative correlation between the proportion of Pueblo and median female earnings in the United States with a correlation coefficient (R) of -0.258 and weighted average of $32,564, a difference of 33.2%.
Median Female Earnings Correlation Summary
| Measurement | Maltese | Pueblo |
| Minimum | $23,250 | $9,219 |
| Maximum | $76,250 | $69,074 |
| Range | $53,000 | $59,855 |
| Mean | $43,370 | $31,512 |
| Median | $42,338 | $30,863 |
| Interquartile 25% (IQ1) | $38,447 | $25,792 |
| Interquartile 75% (IQ3) | $45,921 | $35,833 |
| Interquartile Range (IQR) | $7,474 | $10,041 |
| Standard Deviation (Sample) | $10,204 | $11,084 |
| Standard Deviation (Population) | $10,085 | $10,994 |
Similar Demographics by Median Female Earnings
Demographics Similar to Maltese by Median Female Earnings
In terms of median female earnings, the demographic groups most similar to Maltese are Immigrants from Uzbekistan ($43,363, a difference of 0.010%), Immigrants from Serbia ($43,385, a difference of 0.060%), Immigrants from Lithuania ($43,317, a difference of 0.090%), Immigrants from Eastern Europe ($43,309, a difference of 0.11%), and Australian ($43,308, a difference of 0.11%).
| Demographics | Rating | Rank | Median Female Earnings |
| Immigrants | Czechoslovakia | 100.0 /100 | #44 | Exceptional $43,571 |
| Immigrants | Europe | 100.0 /100 | #45 | Exceptional $43,523 |
| Immigrants | Bolivia | 100.0 /100 | #46 | Exceptional $43,467 |
| Bolivians | 100.0 /100 | #47 | Exceptional $43,445 |
| Immigrants | Indonesia | 100.0 /100 | #48 | Exceptional $43,412 |
| Immigrants | Serbia | 100.0 /100 | #49 | Exceptional $43,385 |
| Immigrants | Uzbekistan | 100.0 /100 | #50 | Exceptional $43,363 |
| Maltese | 100.0 /100 | #51 | Exceptional $43,357 |
| Immigrants | Lithuania | 99.9 /100 | #52 | Exceptional $43,317 |
| Immigrants | Eastern Europe | 99.9 /100 | #53 | Exceptional $43,309 |
| Australians | 99.9 /100 | #54 | Exceptional $43,308 |
| Egyptians | 99.9 /100 | #55 | Exceptional $43,305 |
| Immigrants | Croatia | 99.9 /100 | #56 | Exceptional $43,258 |
| Ethiopians | 99.9 /100 | #57 | Exceptional $43,243 |
| Paraguayans | 99.9 /100 | #58 | Exceptional $43,173 |
Demographics Similar to Pueblo by Median Female Earnings
In terms of median female earnings, the demographic groups most similar to Pueblo are Lumbee ($32,500, a difference of 0.20%), Yup'ik ($32,730, a difference of 0.51%), Navajo ($33,046, a difference of 1.5%), Tohono O'odham ($33,205, a difference of 2.0%), and Immigrants from Mexico ($33,236, a difference of 2.1%).
| Demographics | Rating | Rank | Median Female Earnings |
| Mexicans | 0.0 /100 | #333 | Tragic $33,664 |
| Spanish American Indians | 0.0 /100 | #334 | Tragic $33,625 |
| Creek | 0.0 /100 | #335 | Tragic $33,437 |
| Ottawa | 0.0 /100 | #336 | Tragic $33,378 |
| Yakama | 0.0 /100 | #337 | Tragic $33,354 |
| Immigrants | Cuba | 0.0 /100 | #338 | Tragic $33,291 |
| Immigrants | Mexico | 0.0 /100 | #339 | Tragic $33,236 |
| Tohono O'odham | 0.0 /100 | #340 | Tragic $33,205 |
| Navajo | 0.0 /100 | #341 | Tragic $33,046 |
| Yup'ik | 0.0 /100 | #342 | Tragic $32,730 |
| Pueblo | 0.0 /100 | #343 | Tragic $32,564 |
| Lumbee | 0.0 /100 | #344 | Tragic $32,500 |
| Puerto Ricans | 0.0 /100 | #345 | Tragic $31,560 |
| Arapaho | 0.0 /100 | #346 | Tragic $31,489 |
| Houma | 0.0 /100 | #347 | Tragic $30,343 |