Puget Sound Salish vs Pueblo Associate's Degree
COMPARE
Puget Sound Salish
Pueblo
Associate's Degree
Associate's Degree Comparison
Puget Sound Salish
Pueblo
40.5%
ASSOCIATE'S DEGREE
0.1/ 100
METRIC RATING
273rd/ 347
METRIC RANK
34.0%
ASSOCIATE'S DEGREE
0.0/ 100
METRIC RATING
338th/ 347
METRIC RANK
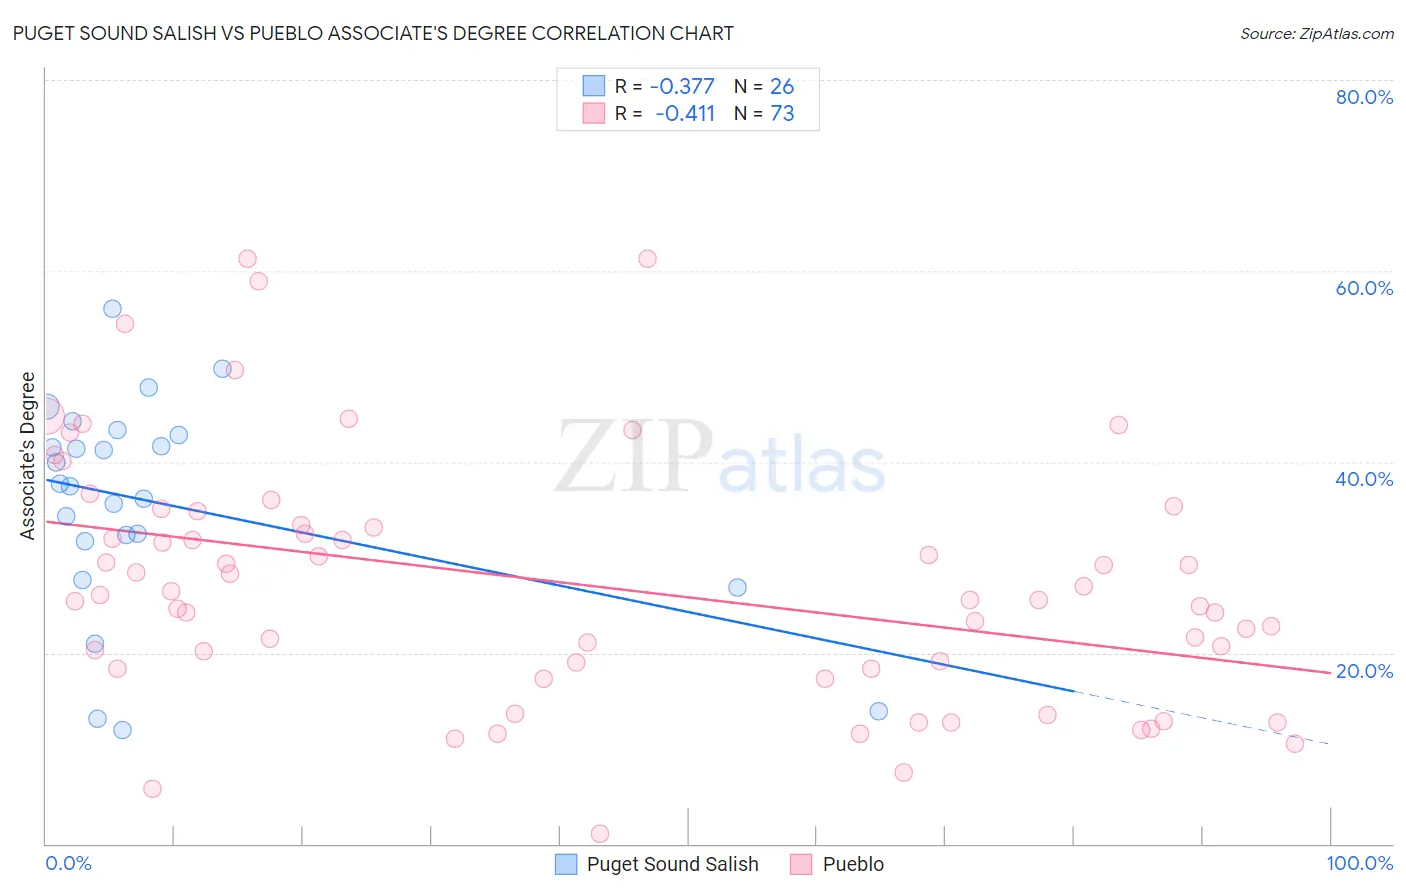
Puget Sound Salish vs Pueblo Associate's Degree Correlation Chart
The statistical analysis conducted on geographies consisting of 46,155,865 people shows a mild negative correlation between the proportion of Puget Sound Salish and percentage of population with at least associate's degree education in the United States with a correlation coefficient (R) of -0.377 and weighted average of 40.5%. Similarly, the statistical analysis conducted on geographies consisting of 120,085,787 people shows a moderate negative correlation between the proportion of Pueblo and percentage of population with at least associate's degree education in the United States with a correlation coefficient (R) of -0.411 and weighted average of 34.0%, a difference of 19.3%.
Associate's Degree Correlation Summary
| Measurement | Puget Sound Salish | Pueblo |
| Minimum | 11.9% | 1.1% |
| Maximum | 56.0% | 61.3% |
| Range | 44.1% | 60.3% |
| Mean | 35.7% | 27.2% |
| Median | 37.6% | 25.6% |
| Interquartile 25% (IQ1) | 31.6% | 18.3% |
| Interquartile 75% (IQ3) | 42.9% | 34.1% |
| Interquartile Range (IQR) | 11.2% | 15.8% |
| Standard Deviation (Sample) | 11.2% | 13.0% |
| Standard Deviation (Population) | 11.0% | 13.0% |
Similar Demographics by Associate's Degree
Demographics Similar to Puget Sound Salish by Associate's Degree
In terms of associate's degree, the demographic groups most similar to Puget Sound Salish are Immigrants from Dominica (40.5%, a difference of 0.14%), Potawatomi (40.4%, a difference of 0.28%), Belizean (40.6%, a difference of 0.29%), Immigrants from Laos (40.7%, a difference of 0.36%), and Puerto Rican (40.4%, a difference of 0.38%).
| Demographics | Rating | Rank | Associate's Degree |
| Samoans | 0.2 /100 | #266 | Tragic 41.1% |
| Hawaiians | 0.2 /100 | #267 | Tragic 40.9% |
| Central American Indians | 0.2 /100 | #268 | Tragic 40.8% |
| Americans | 0.2 /100 | #269 | Tragic 40.8% |
| Chippewa | 0.2 /100 | #270 | Tragic 40.7% |
| Immigrants | Laos | 0.1 /100 | #271 | Tragic 40.7% |
| Belizeans | 0.1 /100 | #272 | Tragic 40.6% |
| Puget Sound Salish | 0.1 /100 | #273 | Tragic 40.5% |
| Immigrants | Dominica | 0.1 /100 | #274 | Tragic 40.5% |
| Potawatomi | 0.1 /100 | #275 | Tragic 40.4% |
| Puerto Ricans | 0.1 /100 | #276 | Tragic 40.4% |
| Blackfeet | 0.1 /100 | #277 | Tragic 40.3% |
| Ottawa | 0.1 /100 | #278 | Tragic 40.3% |
| Immigrants | Nicaragua | 0.1 /100 | #279 | Tragic 40.3% |
| Immigrants | Micronesia | 0.1 /100 | #280 | Tragic 40.2% |
Demographics Similar to Pueblo by Associate's Degree
In terms of associate's degree, the demographic groups most similar to Pueblo are Lumbee (34.1%, a difference of 0.41%), Immigrants from Mexico (33.7%, a difference of 0.71%), Hopi (34.6%, a difference of 1.7%), Spanish American Indian (34.9%, a difference of 2.6%), and Native/Alaskan (34.9%, a difference of 2.8%).
| Demographics | Rating | Rank | Associate's Degree |
| Immigrants | Azores | 0.0 /100 | #331 | Tragic 35.6% |
| Immigrants | Central America | 0.0 /100 | #332 | Tragic 35.0% |
| Mexicans | 0.0 /100 | #333 | Tragic 35.0% |
| Natives/Alaskans | 0.0 /100 | #334 | Tragic 34.9% |
| Spanish American Indians | 0.0 /100 | #335 | Tragic 34.9% |
| Hopi | 0.0 /100 | #336 | Tragic 34.6% |
| Lumbee | 0.0 /100 | #337 | Tragic 34.1% |
| Pueblo | 0.0 /100 | #338 | Tragic 34.0% |
| Immigrants | Mexico | 0.0 /100 | #339 | Tragic 33.7% |
| Navajo | 0.0 /100 | #340 | Tragic 32.6% |
| Inupiat | 0.0 /100 | #341 | Tragic 32.6% |
| Yakama | 0.0 /100 | #342 | Tragic 32.3% |
| Tohono O'odham | 0.0 /100 | #343 | Tragic 31.8% |
| Yuman | 0.0 /100 | #344 | Tragic 31.3% |
| Pima | 0.0 /100 | #345 | Tragic 30.2% |