Maltese vs Immigrants from Afghanistan 9th Grade
COMPARE
Maltese
Immigrants from Afghanistan
9th Grade
9th Grade Comparison
Maltese
Immigrants from Afghanistan
96.3%
9TH GRADE
100.0/ 100
METRIC RATING
30th/ 347
METRIC RANK
94.0%
9TH GRADE
0.5/ 100
METRIC RATING
256th/ 347
METRIC RANK
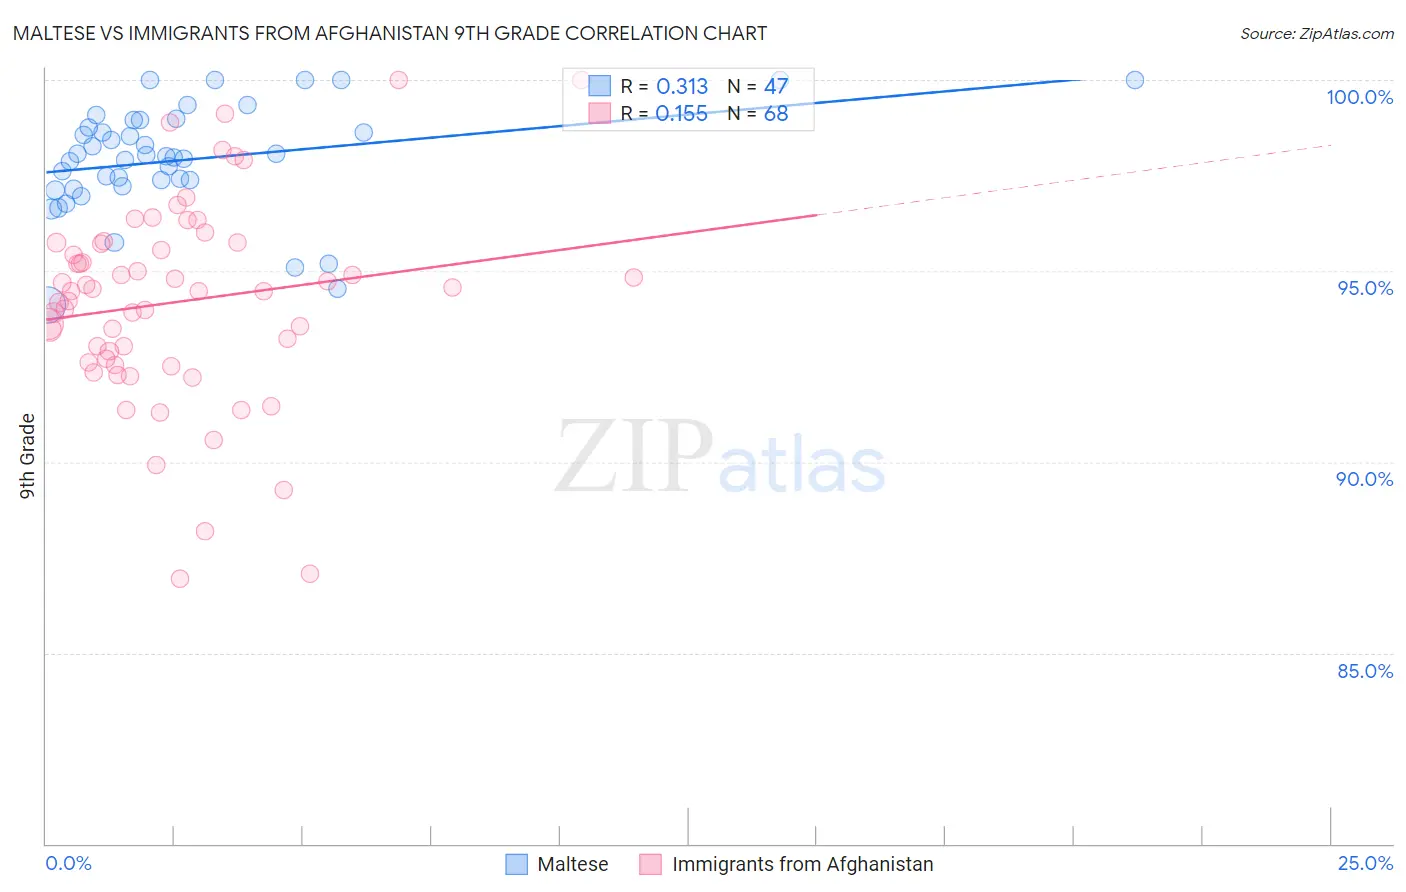
Maltese vs Immigrants from Afghanistan 9th Grade Correlation Chart
The statistical analysis conducted on geographies consisting of 126,476,608 people shows a mild positive correlation between the proportion of Maltese and percentage of population with at least 9th grade education in the United States with a correlation coefficient (R) of 0.313 and weighted average of 96.3%. Similarly, the statistical analysis conducted on geographies consisting of 147,629,924 people shows a poor positive correlation between the proportion of Immigrants from Afghanistan and percentage of population with at least 9th grade education in the United States with a correlation coefficient (R) of 0.155 and weighted average of 94.0%, a difference of 2.5%.
9th Grade Correlation Summary
| Measurement | Maltese | Immigrants from Afghanistan |
| Minimum | 94.1% | 86.9% |
| Maximum | 100.0% | 100.0% |
| Range | 5.9% | 13.1% |
| Mean | 97.9% | 94.2% |
| Median | 98.0% | 94.5% |
| Interquartile 25% (IQ1) | 97.2% | 92.7% |
| Interquartile 75% (IQ3) | 99.0% | 95.7% |
| Interquartile Range (IQR) | 1.7% | 3.1% |
| Standard Deviation (Sample) | 1.4% | 2.7% |
| Standard Deviation (Population) | 1.4% | 2.6% |
Similar Demographics by 9th Grade
Demographics Similar to Maltese by 9th Grade
In terms of 9th grade, the demographic groups most similar to Maltese are British (96.3%, a difference of 0.0%), Belgian (96.3%, a difference of 0.010%), Chinese (96.3%, a difference of 0.020%), Luxembourger (96.3%, a difference of 0.020%), and Scotch-Irish (96.3%, a difference of 0.030%).
| Demographics | Rating | Rank | 9th Grade |
| Czechs | 100.0 /100 | #23 | Exceptional 96.4% |
| Latvians | 100.0 /100 | #24 | Exceptional 96.4% |
| French | 100.0 /100 | #25 | Exceptional 96.3% |
| French Canadians | 100.0 /100 | #26 | Exceptional 96.3% |
| Scotch-Irish | 100.0 /100 | #27 | Exceptional 96.3% |
| Eastern Europeans | 100.0 /100 | #28 | Exceptional 96.3% |
| Chinese | 100.0 /100 | #29 | Exceptional 96.3% |
| Maltese | 100.0 /100 | #30 | Exceptional 96.3% |
| British | 100.0 /100 | #31 | Exceptional 96.3% |
| Belgians | 100.0 /100 | #32 | Exceptional 96.3% |
| Luxembourgers | 100.0 /100 | #33 | Exceptional 96.3% |
| Hungarians | 100.0 /100 | #34 | Exceptional 96.2% |
| Bulgarians | 99.9 /100 | #35 | Exceptional 96.2% |
| Northern Europeans | 99.9 /100 | #36 | Exceptional 96.2% |
| Estonians | 99.9 /100 | #37 | Exceptional 96.1% |
Demographics Similar to Immigrants from Afghanistan by 9th Grade
In terms of 9th grade, the demographic groups most similar to Immigrants from Afghanistan are Immigrants from Nigeria (94.0%, a difference of 0.010%), Immigrants from Costa Rica (94.0%, a difference of 0.020%), Immigrants from Thailand (93.9%, a difference of 0.020%), Ghanaian (93.9%, a difference of 0.020%), and Pima (93.9%, a difference of 0.040%).
| Demographics | Rating | Rank | 9th Grade |
| Uruguayans | 1.3 /100 | #249 | Tragic 94.1% |
| Immigrants | Hong Kong | 1.3 /100 | #250 | Tragic 94.1% |
| Jamaicans | 1.0 /100 | #251 | Tragic 94.1% |
| Immigrants | Senegal | 0.9 /100 | #252 | Tragic 94.1% |
| Colombians | 0.8 /100 | #253 | Tragic 94.0% |
| U.S. Virgin Islanders | 0.7 /100 | #254 | Tragic 94.0% |
| Immigrants | Nigeria | 0.6 /100 | #255 | Tragic 94.0% |
| Immigrants | Afghanistan | 0.5 /100 | #256 | Tragic 94.0% |
| Immigrants | Costa Rica | 0.5 /100 | #257 | Tragic 94.0% |
| Immigrants | Thailand | 0.5 /100 | #258 | Tragic 93.9% |
| Ghanaians | 0.5 /100 | #259 | Tragic 93.9% |
| Pima | 0.4 /100 | #260 | Tragic 93.9% |
| South Americans | 0.4 /100 | #261 | Tragic 93.9% |
| Immigrants | Jamaica | 0.4 /100 | #262 | Tragic 93.9% |
| Immigrants | Uzbekistan | 0.4 /100 | #263 | Tragic 93.9% |