Maltese vs Immigrants from Norway Disability Age Over 75
COMPARE
Maltese
Immigrants from Norway
Disability Age Over 75
Disability Age Over 75 Comparison
Maltese
Immigrants from Norway
45.8%
DISABILITY AGE OVER 75
99.6/ 100
METRIC RATING
55th/ 347
METRIC RANK
45.9%
DISABILITY AGE OVER 75
99.5/ 100
METRIC RATING
63rd/ 347
METRIC RANK
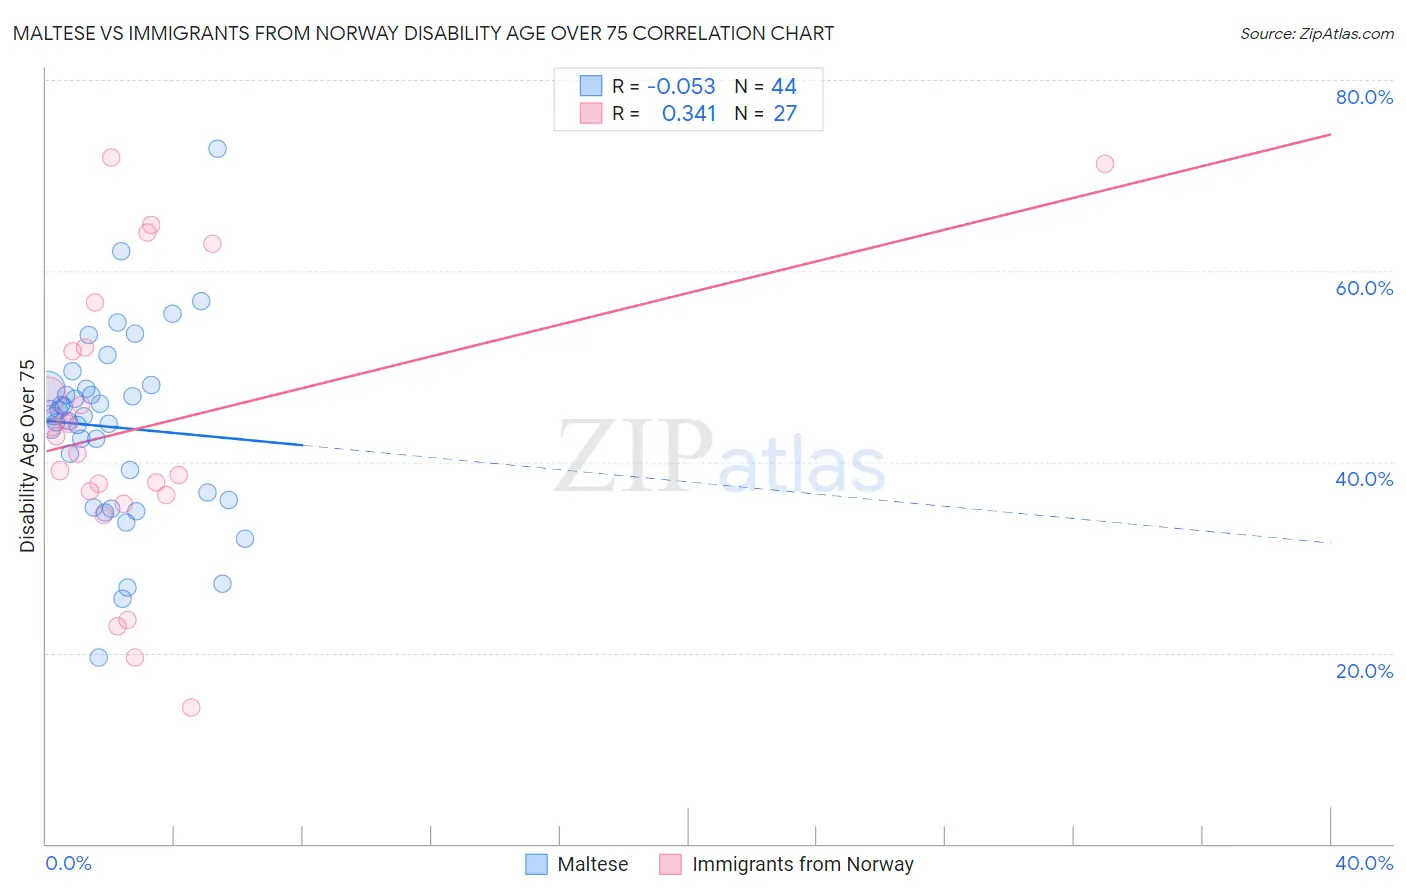
Maltese vs Immigrants from Norway Disability Age Over 75 Correlation Chart
The statistical analysis conducted on geographies consisting of 126,418,061 people shows a slight negative correlation between the proportion of Maltese and percentage of population with a disability over the age of 75 in the United States with a correlation coefficient (R) of -0.053 and weighted average of 45.8%. Similarly, the statistical analysis conducted on geographies consisting of 116,660,458 people shows a mild positive correlation between the proportion of Immigrants from Norway and percentage of population with a disability over the age of 75 in the United States with a correlation coefficient (R) of 0.341 and weighted average of 45.9%, a difference of 0.19%.
Disability Age Over 75 Correlation Summary
| Measurement | Maltese | Immigrants from Norway |
| Minimum | 19.4% | 14.3% |
| Maximum | 72.8% | 71.9% |
| Range | 53.3% | 57.6% |
| Mean | 43.6% | 43.7% |
| Median | 44.8% | 42.7% |
| Interquartile 25% (IQ1) | 36.4% | 36.5% |
| Interquartile 75% (IQ3) | 47.7% | 52.0% |
| Interquartile Range (IQR) | 11.3% | 15.5% |
| Standard Deviation (Sample) | 9.8% | 14.9% |
| Standard Deviation (Population) | 9.7% | 14.6% |
Demographics Similar to Maltese and Immigrants from Norway by Disability Age Over 75
In terms of disability age over 75, the demographic groups most similar to Maltese are Slovak (45.8%, a difference of 0.0%), Immigrants from Netherlands (45.9%, a difference of 0.070%), Immigrants from Italy (45.8%, a difference of 0.080%), Immigrants from Turkey (45.9%, a difference of 0.080%), and Immigrants from Israel (45.9%, a difference of 0.080%). Similarly, the demographic groups most similar to Immigrants from Norway are Immigrants from North Macedonia (45.9%, a difference of 0.0%), Austrian (46.0%, a difference of 0.040%), Burmese (45.9%, a difference of 0.050%), Immigrants from England (46.0%, a difference of 0.050%), and Immigrants from Argentina (45.9%, a difference of 0.070%).
| Demographics | Rating | Rank | Disability Age Over 75 |
| Immigrants | North America | 99.8 /100 | #49 | Exceptional 45.7% |
| Belgians | 99.7 /100 | #50 | Exceptional 45.8% |
| Immigrants | Korea | 99.7 /100 | #51 | Exceptional 45.8% |
| Immigrants | France | 99.7 /100 | #52 | Exceptional 45.8% |
| Immigrants | Italy | 99.7 /100 | #53 | Exceptional 45.8% |
| Slovaks | 99.6 /100 | #54 | Exceptional 45.8% |
| Maltese | 99.6 /100 | #55 | Exceptional 45.8% |
| Immigrants | Netherlands | 99.6 /100 | #56 | Exceptional 45.9% |
| Immigrants | Turkey | 99.6 /100 | #57 | Exceptional 45.9% |
| Immigrants | Israel | 99.6 /100 | #58 | Exceptional 45.9% |
| Iranians | 99.6 /100 | #59 | Exceptional 45.9% |
| Immigrants | Europe | 99.6 /100 | #60 | Exceptional 45.9% |
| Immigrants | Argentina | 99.6 /100 | #61 | Exceptional 45.9% |
| Burmese | 99.5 /100 | #62 | Exceptional 45.9% |
| Immigrants | Norway | 99.5 /100 | #63 | Exceptional 45.9% |
| Immigrants | North Macedonia | 99.5 /100 | #64 | Exceptional 45.9% |
| Austrians | 99.5 /100 | #65 | Exceptional 46.0% |
| Immigrants | England | 99.5 /100 | #66 | Exceptional 46.0% |
| Immigrants | Spain | 99.4 /100 | #67 | Exceptional 46.0% |
| Immigrants | South Central Asia | 99.4 /100 | #68 | Exceptional 46.0% |
| Immigrants | Romania | 99.3 /100 | #69 | Exceptional 46.0% |