Maltese vs Ugandan Doctorate Degree
COMPARE
Maltese
Ugandan
Doctorate Degree
Doctorate Degree Comparison
Maltese
Ugandans
2.1%
DOCTORATE DEGREE
96.2/ 100
METRIC RATING
116th/ 347
METRIC RANK
2.2%
DOCTORATE DEGREE
99.7/ 100
METRIC RATING
80th/ 347
METRIC RANK
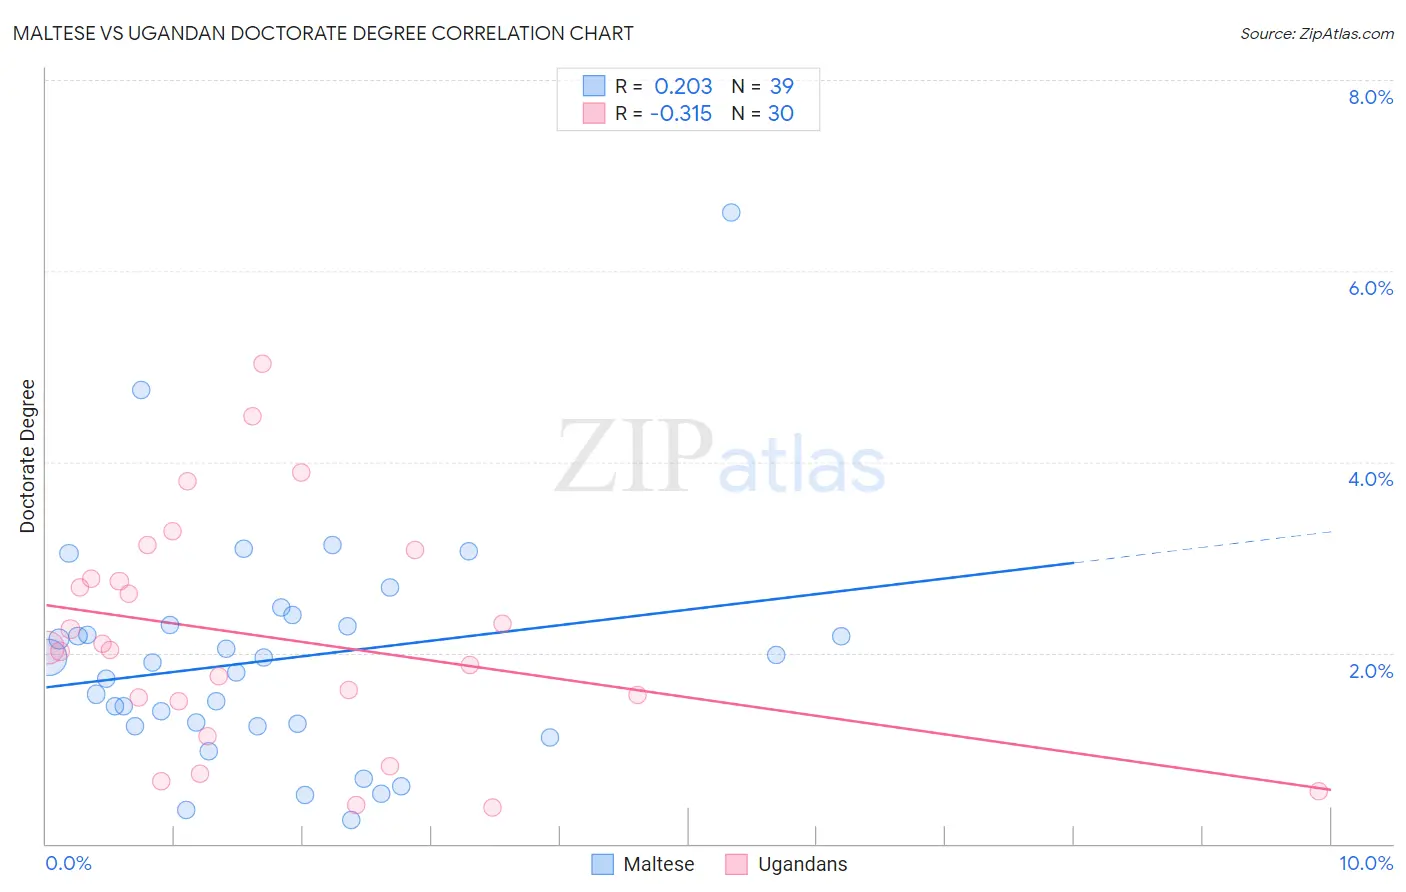
Maltese vs Ugandan Doctorate Degree Correlation Chart
The statistical analysis conducted on geographies consisting of 126,152,817 people shows a weak positive correlation between the proportion of Maltese and percentage of population with at least doctorate degree education in the United States with a correlation coefficient (R) of 0.203 and weighted average of 2.1%. Similarly, the statistical analysis conducted on geographies consisting of 93,908,967 people shows a mild negative correlation between the proportion of Ugandans and percentage of population with at least doctorate degree education in the United States with a correlation coefficient (R) of -0.315 and weighted average of 2.2%, a difference of 8.2%.
Doctorate Degree Correlation Summary
| Measurement | Maltese | Ugandan |
| Minimum | 0.25% | 0.38% |
| Maximum | 6.6% | 5.0% |
| Range | 6.4% | 4.6% |
| Mean | 1.9% | 2.2% |
| Median | 1.9% | 2.0% |
| Interquartile 25% (IQ1) | 1.2% | 1.5% |
| Interquartile 75% (IQ3) | 2.3% | 2.8% |
| Interquartile Range (IQR) | 1.1% | 1.3% |
| Standard Deviation (Sample) | 1.2% | 1.2% |
| Standard Deviation (Population) | 1.2% | 1.2% |
Similar Demographics by Doctorate Degree
Demographics Similar to Maltese by Doctorate Degree
In terms of doctorate degree, the demographic groups most similar to Maltese are Lebanese (2.1%, a difference of 0.17%), Icelander (2.1%, a difference of 0.21%), Pakistani (2.0%, a difference of 0.34%), Taiwanese (2.1%, a difference of 0.46%), and Immigrants from Croatia (2.1%, a difference of 0.54%).
| Demographics | Rating | Rank | Doctorate Degree |
| Ukrainians | 97.2 /100 | #109 | Exceptional 2.1% |
| Brazilians | 97.2 /100 | #110 | Exceptional 2.1% |
| Immigrants | Pakistan | 97.1 /100 | #111 | Exceptional 2.1% |
| Syrians | 97.1 /100 | #112 | Exceptional 2.1% |
| Immigrants | Italy | 96.9 /100 | #113 | Exceptional 2.1% |
| Immigrants | Croatia | 96.8 /100 | #114 | Exceptional 2.1% |
| Taiwanese | 96.7 /100 | #115 | Exceptional 2.1% |
| Maltese | 96.2 /100 | #116 | Exceptional 2.1% |
| Lebanese | 96.0 /100 | #117 | Exceptional 2.1% |
| Icelanders | 96.0 /100 | #118 | Exceptional 2.1% |
| Pakistanis | 95.8 /100 | #119 | Exceptional 2.0% |
| Immigrants | Morocco | 95.5 /100 | #120 | Exceptional 2.0% |
| Immigrants | Jordan | 94.8 /100 | #121 | Exceptional 2.0% |
| Immigrants | Southern Europe | 94.7 /100 | #122 | Exceptional 2.0% |
| Croatians | 94.0 /100 | #123 | Exceptional 2.0% |
Demographics Similar to Ugandans by Doctorate Degree
In terms of doctorate degree, the demographic groups most similar to Ugandans are Immigrants from Argentina (2.2%, a difference of 0.050%), Northern European (2.2%, a difference of 0.28%), Immigrants from Belarus (2.2%, a difference of 0.35%), Immigrants from Uganda (2.2%, a difference of 0.59%), and Immigrants from Lithuania (2.2%, a difference of 0.77%).
| Demographics | Rating | Rank | Doctorate Degree |
| Immigrants | Bulgaria | 99.8 /100 | #73 | Exceptional 2.3% |
| Immigrants | North America | 99.8 /100 | #74 | Exceptional 2.2% |
| Immigrants | Western Asia | 99.8 /100 | #75 | Exceptional 2.2% |
| Immigrants | Hungary | 99.8 /100 | #76 | Exceptional 2.2% |
| Immigrants | Lebanon | 99.8 /100 | #77 | Exceptional 2.2% |
| Immigrants | Belarus | 99.7 /100 | #78 | Exceptional 2.2% |
| Northern Europeans | 99.7 /100 | #79 | Exceptional 2.2% |
| Ugandans | 99.7 /100 | #80 | Exceptional 2.2% |
| Immigrants | Argentina | 99.7 /100 | #81 | Exceptional 2.2% |
| Immigrants | Uganda | 99.6 /100 | #82 | Exceptional 2.2% |
| Immigrants | Lithuania | 99.6 /100 | #83 | Exceptional 2.2% |
| Immigrants | England | 99.6 /100 | #84 | Exceptional 2.2% |
| Immigrants | Brazil | 99.6 /100 | #85 | Exceptional 2.2% |
| Egyptians | 99.4 /100 | #86 | Exceptional 2.2% |
| Immigrants | Zimbabwe | 99.4 /100 | #87 | Exceptional 2.2% |