Maltese vs Immigrants from Yemen Doctorate Degree
COMPARE
Maltese
Immigrants from Yemen
Doctorate Degree
Doctorate Degree Comparison
Maltese
Immigrants from Yemen
2.1%
DOCTORATE DEGREE
96.2/ 100
METRIC RATING
116th/ 347
METRIC RANK
1.4%
DOCTORATE DEGREE
0.2/ 100
METRIC RATING
293rd/ 347
METRIC RANK
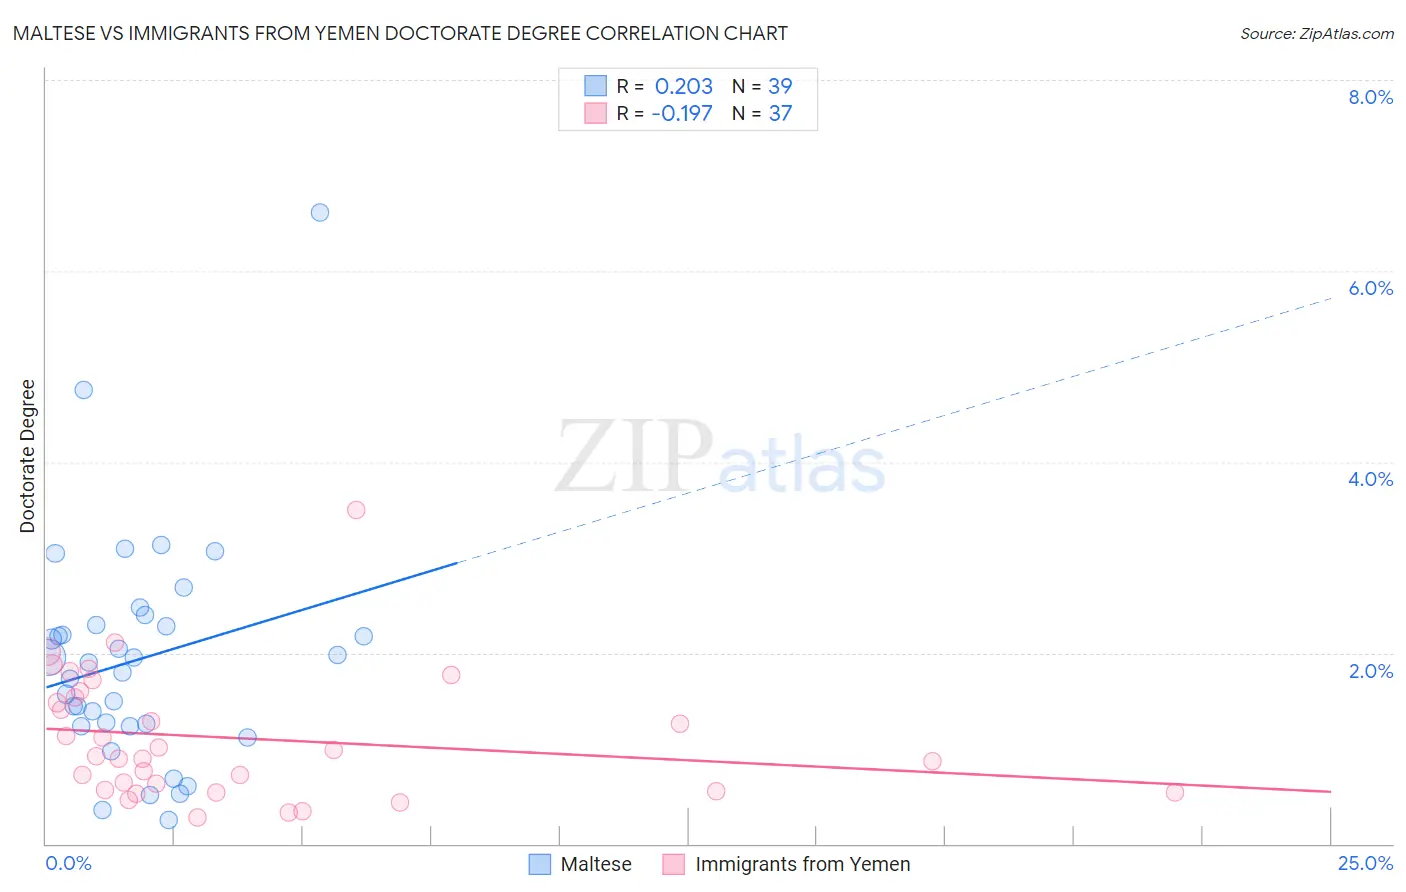
Maltese vs Immigrants from Yemen Doctorate Degree Correlation Chart
The statistical analysis conducted on geographies consisting of 126,152,817 people shows a weak positive correlation between the proportion of Maltese and percentage of population with at least doctorate degree education in the United States with a correlation coefficient (R) of 0.203 and weighted average of 2.1%. Similarly, the statistical analysis conducted on geographies consisting of 82,189,372 people shows a poor negative correlation between the proportion of Immigrants from Yemen and percentage of population with at least doctorate degree education in the United States with a correlation coefficient (R) of -0.197 and weighted average of 1.4%, a difference of 43.6%.
Doctorate Degree Correlation Summary
| Measurement | Maltese | Immigrants from Yemen |
| Minimum | 0.25% | 0.27% |
| Maximum | 6.6% | 3.5% |
| Range | 6.4% | 3.2% |
| Mean | 1.9% | 1.1% |
| Median | 1.9% | 0.91% |
| Interquartile 25% (IQ1) | 1.2% | 0.56% |
| Interquartile 75% (IQ3) | 2.3% | 1.6% |
| Interquartile Range (IQR) | 1.1% | 1.0% |
| Standard Deviation (Sample) | 1.2% | 0.67% |
| Standard Deviation (Population) | 1.2% | 0.66% |
Similar Demographics by Doctorate Degree
Demographics Similar to Maltese by Doctorate Degree
In terms of doctorate degree, the demographic groups most similar to Maltese are Lebanese (2.1%, a difference of 0.17%), Icelander (2.1%, a difference of 0.21%), Pakistani (2.0%, a difference of 0.34%), Taiwanese (2.1%, a difference of 0.46%), and Immigrants from Croatia (2.1%, a difference of 0.54%).
| Demographics | Rating | Rank | Doctorate Degree |
| Ukrainians | 97.2 /100 | #109 | Exceptional 2.1% |
| Brazilians | 97.2 /100 | #110 | Exceptional 2.1% |
| Immigrants | Pakistan | 97.1 /100 | #111 | Exceptional 2.1% |
| Syrians | 97.1 /100 | #112 | Exceptional 2.1% |
| Immigrants | Italy | 96.9 /100 | #113 | Exceptional 2.1% |
| Immigrants | Croatia | 96.8 /100 | #114 | Exceptional 2.1% |
| Taiwanese | 96.7 /100 | #115 | Exceptional 2.1% |
| Maltese | 96.2 /100 | #116 | Exceptional 2.1% |
| Lebanese | 96.0 /100 | #117 | Exceptional 2.1% |
| Icelanders | 96.0 /100 | #118 | Exceptional 2.1% |
| Pakistanis | 95.8 /100 | #119 | Exceptional 2.0% |
| Immigrants | Morocco | 95.5 /100 | #120 | Exceptional 2.0% |
| Immigrants | Jordan | 94.8 /100 | #121 | Exceptional 2.0% |
| Immigrants | Southern Europe | 94.7 /100 | #122 | Exceptional 2.0% |
| Croatians | 94.0 /100 | #123 | Exceptional 2.0% |
Demographics Similar to Immigrants from Yemen by Doctorate Degree
In terms of doctorate degree, the demographic groups most similar to Immigrants from Yemen are Alaska Native (1.4%, a difference of 0.59%), Samoan (1.4%, a difference of 0.71%), Black/African American (1.4%, a difference of 0.76%), Choctaw (1.4%, a difference of 0.99%), and Cape Verdean (1.4%, a difference of 1.0%).
| Demographics | Rating | Rank | Doctorate Degree |
| Cherokee | 0.3 /100 | #286 | Tragic 1.5% |
| Cajuns | 0.3 /100 | #287 | Tragic 1.5% |
| Immigrants | El Salvador | 0.3 /100 | #288 | Tragic 1.4% |
| Cape Verdeans | 0.3 /100 | #289 | Tragic 1.4% |
| Choctaw | 0.3 /100 | #290 | Tragic 1.4% |
| Blacks/African Americans | 0.3 /100 | #291 | Tragic 1.4% |
| Alaska Natives | 0.3 /100 | #292 | Tragic 1.4% |
| Immigrants | Yemen | 0.2 /100 | #293 | Tragic 1.4% |
| Samoans | 0.2 /100 | #294 | Tragic 1.4% |
| Guatemalans | 0.2 /100 | #295 | Tragic 1.4% |
| Immigrants | Ecuador | 0.2 /100 | #296 | Tragic 1.4% |
| Tsimshian | 0.2 /100 | #297 | Tragic 1.4% |
| Puerto Ricans | 0.1 /100 | #298 | Tragic 1.4% |
| Belizeans | 0.1 /100 | #299 | Tragic 1.4% |
| Immigrants | Guatemala | 0.1 /100 | #300 | Tragic 1.4% |