Romanian vs Cree High School Diploma
COMPARE
Romanian
Cree
High School Diploma
High School Diploma Comparison
Romanians
Cree
90.7%
HIGH SCHOOL DIPLOMA
98.9/ 100
METRIC RATING
85th/ 347
METRIC RANK
89.3%
HIGH SCHOOL DIPLOMA
61.1/ 100
METRIC RATING
163rd/ 347
METRIC RANK
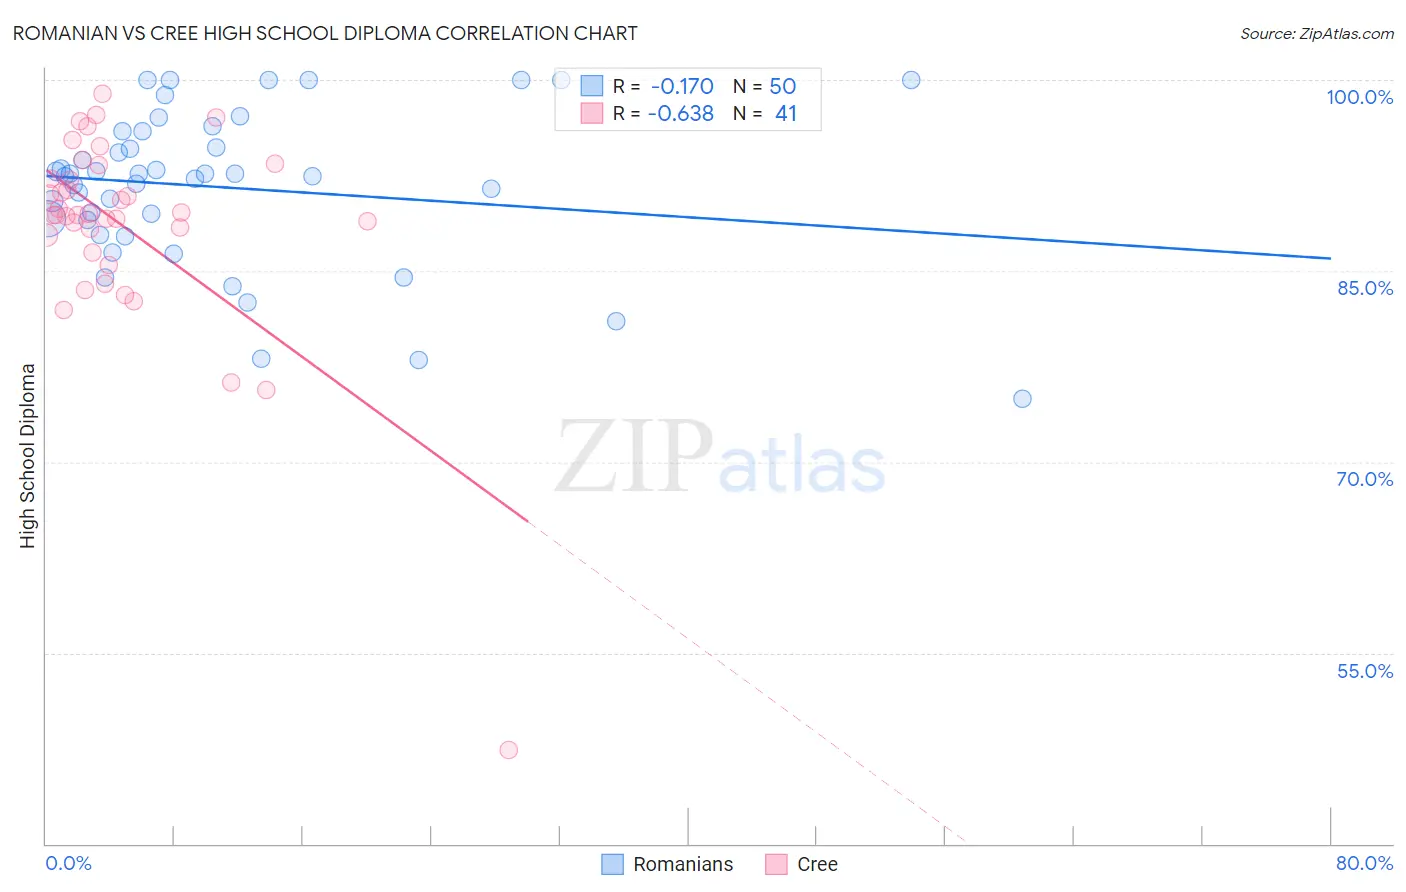
Romanian vs Cree High School Diploma Correlation Chart
The statistical analysis conducted on geographies consisting of 377,905,122 people shows a poor negative correlation between the proportion of Romanians and percentage of population with at least high school diploma education in the United States with a correlation coefficient (R) of -0.170 and weighted average of 90.7%. Similarly, the statistical analysis conducted on geographies consisting of 76,211,744 people shows a significant negative correlation between the proportion of Cree and percentage of population with at least high school diploma education in the United States with a correlation coefficient (R) of -0.638 and weighted average of 89.3%, a difference of 1.5%.
High School Diploma Correlation Summary
| Measurement | Romanian | Cree |
| Minimum | 75.0% | 47.4% |
| Maximum | 100.0% | 98.9% |
| Range | 25.0% | 51.6% |
| Mean | 91.6% | 88.5% |
| Median | 92.6% | 89.4% |
| Interquartile 25% (IQ1) | 89.0% | 87.1% |
| Interquartile 75% (IQ3) | 95.9% | 92.8% |
| Interquartile Range (IQR) | 7.0% | 5.7% |
| Standard Deviation (Sample) | 6.1% | 8.3% |
| Standard Deviation (Population) | 6.0% | 8.2% |
Similar Demographics by High School Diploma
Demographics Similar to Romanians by High School Diploma
In terms of high school diploma, the demographic groups most similar to Romanians are Immigrants from Bulgaria (90.6%, a difference of 0.010%), Immigrants from Turkey (90.6%, a difference of 0.010%), Immigrants from France (90.6%, a difference of 0.030%), Canadian (90.6%, a difference of 0.050%), and Celtic (90.6%, a difference of 0.060%).
| Demographics | Rating | Rank | High School Diploma |
| Burmese | 99.3 /100 | #78 | Exceptional 90.8% |
| Immigrants | Denmark | 99.3 /100 | #79 | Exceptional 90.8% |
| Immigrants | England | 99.3 /100 | #80 | Exceptional 90.8% |
| Immigrants | Switzerland | 99.3 /100 | #81 | Exceptional 90.8% |
| Scotch-Irish | 99.2 /100 | #82 | Exceptional 90.8% |
| Immigrants | Moldova | 99.2 /100 | #83 | Exceptional 90.7% |
| Immigrants | Saudi Arabia | 99.1 /100 | #84 | Exceptional 90.7% |
| Romanians | 98.9 /100 | #85 | Exceptional 90.7% |
| Immigrants | Bulgaria | 98.9 /100 | #86 | Exceptional 90.6% |
| Immigrants | Turkey | 98.9 /100 | #87 | Exceptional 90.6% |
| Immigrants | France | 98.8 /100 | #88 | Exceptional 90.6% |
| Canadians | 98.7 /100 | #89 | Exceptional 90.6% |
| Celtics | 98.7 /100 | #90 | Exceptional 90.6% |
| South Africans | 98.6 /100 | #91 | Exceptional 90.6% |
| Swiss | 98.6 /100 | #92 | Exceptional 90.6% |
Demographics Similar to Cree by High School Diploma
In terms of high school diploma, the demographic groups most similar to Cree are Brazilian (89.3%, a difference of 0.0%), Bermudan (89.3%, a difference of 0.0%), Immigrants from Nepal (89.3%, a difference of 0.0%), Immigrants from China (89.3%, a difference of 0.010%), and Laotian (89.3%, a difference of 0.010%).
| Demographics | Rating | Rank | High School Diploma |
| Immigrants | Argentina | 65.5 /100 | #156 | Good 89.4% |
| Immigrants | Malaysia | 63.5 /100 | #157 | Good 89.3% |
| Immigrants | Pakistan | 62.5 /100 | #158 | Good 89.3% |
| Immigrants | China | 62.0 /100 | #159 | Good 89.3% |
| Laotians | 61.8 /100 | #160 | Good 89.3% |
| Brazilians | 61.2 /100 | #161 | Good 89.3% |
| Bermudans | 61.1 /100 | #162 | Good 89.3% |
| Cree | 61.1 /100 | #163 | Good 89.3% |
| Immigrants | Nepal | 61.1 /100 | #164 | Good 89.3% |
| Immigrants | Asia | 59.8 /100 | #165 | Average 89.3% |
| Immigrants | Albania | 59.4 /100 | #166 | Average 89.3% |
| Immigrants | Hong Kong | 58.6 /100 | #167 | Average 89.3% |
| Delaware | 55.8 /100 | #168 | Average 89.2% |
| Iroquois | 55.1 /100 | #169 | Average 89.2% |
| Immigrants | Morocco | 53.3 /100 | #170 | Average 89.2% |