Immigrants from Sierra Leone vs Cree High School Diploma
COMPARE
Immigrants from Sierra Leone
Cree
High School Diploma
High School Diploma Comparison
Immigrants from Sierra Leone
Cree
88.6%
HIGH SCHOOL DIPLOMA
15.8/ 100
METRIC RATING
207th/ 347
METRIC RANK
89.3%
HIGH SCHOOL DIPLOMA
61.1/ 100
METRIC RATING
163rd/ 347
METRIC RANK
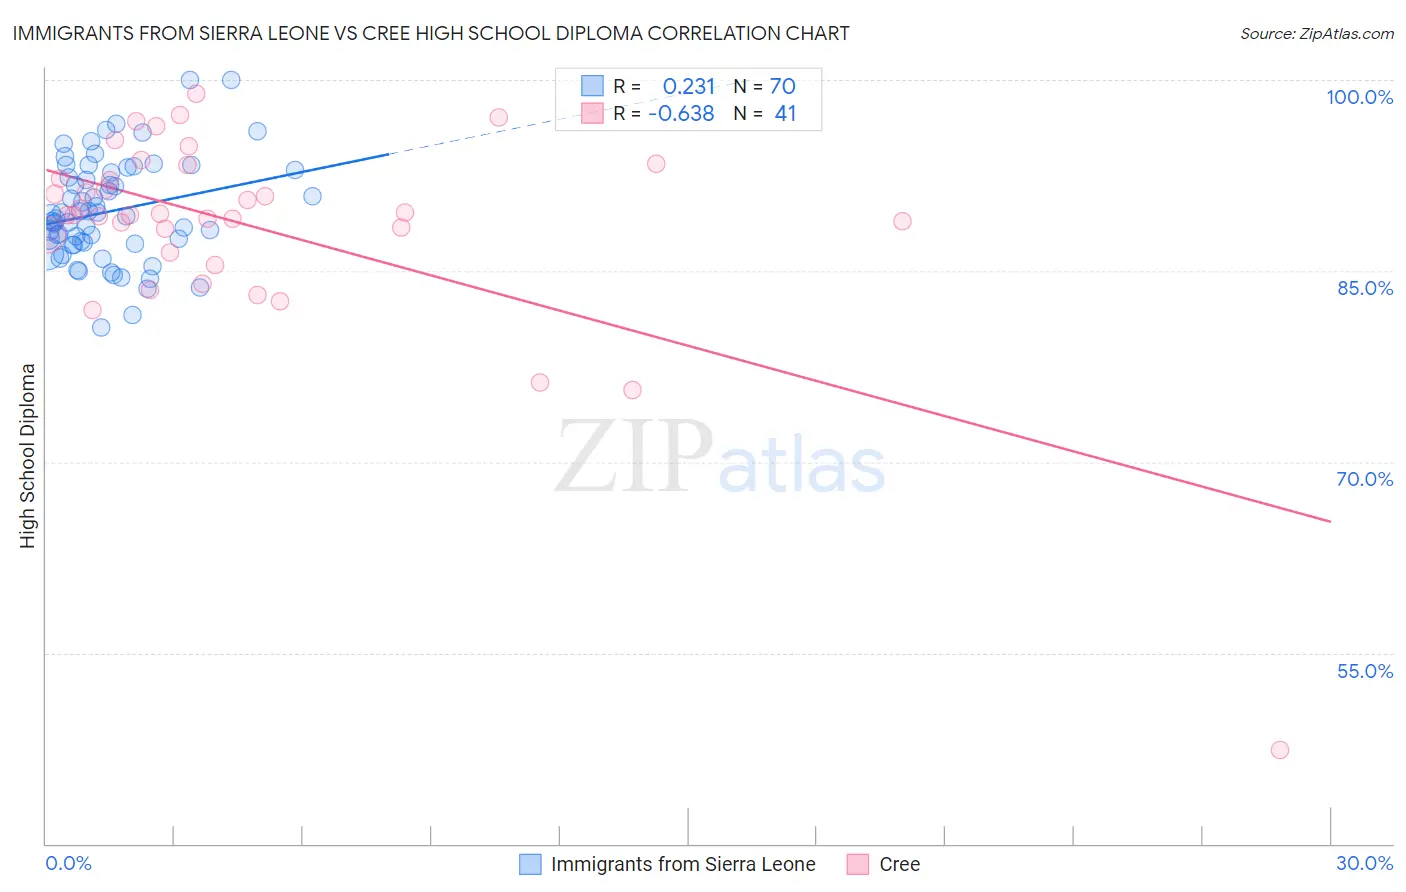
Immigrants from Sierra Leone vs Cree High School Diploma Correlation Chart
The statistical analysis conducted on geographies consisting of 101,634,956 people shows a weak positive correlation between the proportion of Immigrants from Sierra Leone and percentage of population with at least high school diploma education in the United States with a correlation coefficient (R) of 0.231 and weighted average of 88.6%. Similarly, the statistical analysis conducted on geographies consisting of 76,211,744 people shows a significant negative correlation between the proportion of Cree and percentage of population with at least high school diploma education in the United States with a correlation coefficient (R) of -0.638 and weighted average of 89.3%, a difference of 0.81%.
High School Diploma Correlation Summary
| Measurement | Immigrants from Sierra Leone | Cree |
| Minimum | 80.6% | 47.4% |
| Maximum | 100.0% | 98.9% |
| Range | 19.4% | 51.6% |
| Mean | 89.7% | 88.5% |
| Median | 89.2% | 89.4% |
| Interquartile 25% (IQ1) | 87.1% | 87.1% |
| Interquartile 75% (IQ3) | 92.8% | 92.8% |
| Interquartile Range (IQR) | 5.6% | 5.7% |
| Standard Deviation (Sample) | 4.0% | 8.3% |
| Standard Deviation (Population) | 4.0% | 8.2% |
Similar Demographics by High School Diploma
Demographics Similar to Immigrants from Sierra Leone by High School Diploma
In terms of high school diploma, the demographic groups most similar to Immigrants from Sierra Leone are Arapaho (88.6%, a difference of 0.010%), Immigrants from Micronesia (88.6%, a difference of 0.020%), Armenian (88.6%, a difference of 0.040%), Portuguese (88.5%, a difference of 0.040%), and Cherokee (88.5%, a difference of 0.040%).
| Demographics | Rating | Rank | High School Diploma |
| Hawaiians | 18.3 /100 | #200 | Poor 88.6% |
| Koreans | 18.1 /100 | #201 | Poor 88.6% |
| Panamanians | 18.0 /100 | #202 | Poor 88.6% |
| Somalis | 17.5 /100 | #203 | Poor 88.6% |
| Armenians | 17.2 /100 | #204 | Poor 88.6% |
| Immigrants | Micronesia | 16.4 /100 | #205 | Poor 88.6% |
| Arapaho | 16.1 /100 | #206 | Poor 88.6% |
| Immigrants | Sierra Leone | 15.8 /100 | #207 | Poor 88.6% |
| Portuguese | 14.4 /100 | #208 | Poor 88.5% |
| Cherokee | 14.3 /100 | #209 | Poor 88.5% |
| Samoans | 14.0 /100 | #210 | Poor 88.5% |
| Inupiat | 13.1 /100 | #211 | Poor 88.5% |
| South American Indians | 12.2 /100 | #212 | Poor 88.5% |
| Immigrants | Somalia | 11.3 /100 | #213 | Poor 88.4% |
| Immigrants | Cameroon | 10.9 /100 | #214 | Poor 88.4% |
Demographics Similar to Cree by High School Diploma
In terms of high school diploma, the demographic groups most similar to Cree are Brazilian (89.3%, a difference of 0.0%), Bermudan (89.3%, a difference of 0.0%), Immigrants from Nepal (89.3%, a difference of 0.0%), Immigrants from China (89.3%, a difference of 0.010%), and Laotian (89.3%, a difference of 0.010%).
| Demographics | Rating | Rank | High School Diploma |
| Immigrants | Argentina | 65.5 /100 | #156 | Good 89.4% |
| Immigrants | Malaysia | 63.5 /100 | #157 | Good 89.3% |
| Immigrants | Pakistan | 62.5 /100 | #158 | Good 89.3% |
| Immigrants | China | 62.0 /100 | #159 | Good 89.3% |
| Laotians | 61.8 /100 | #160 | Good 89.3% |
| Brazilians | 61.2 /100 | #161 | Good 89.3% |
| Bermudans | 61.1 /100 | #162 | Good 89.3% |
| Cree | 61.1 /100 | #163 | Good 89.3% |
| Immigrants | Nepal | 61.1 /100 | #164 | Good 89.3% |
| Immigrants | Asia | 59.8 /100 | #165 | Average 89.3% |
| Immigrants | Albania | 59.4 /100 | #166 | Average 89.3% |
| Immigrants | Hong Kong | 58.6 /100 | #167 | Average 89.3% |
| Delaware | 55.8 /100 | #168 | Average 89.2% |
| Iroquois | 55.1 /100 | #169 | Average 89.2% |
| Immigrants | Morocco | 53.3 /100 | #170 | Average 89.2% |