Malaysian vs Costa Rican Master's Degree
COMPARE
Malaysian
Costa Rican
Master's Degree
Master's Degree Comparison
Malaysians
Costa Ricans
12.0%
MASTER'S DEGREE
0.2/ 100
METRIC RATING
281st/ 347
METRIC RANK
15.0%
MASTER'S DEGREE
52.5/ 100
METRIC RATING
173rd/ 347
METRIC RANK
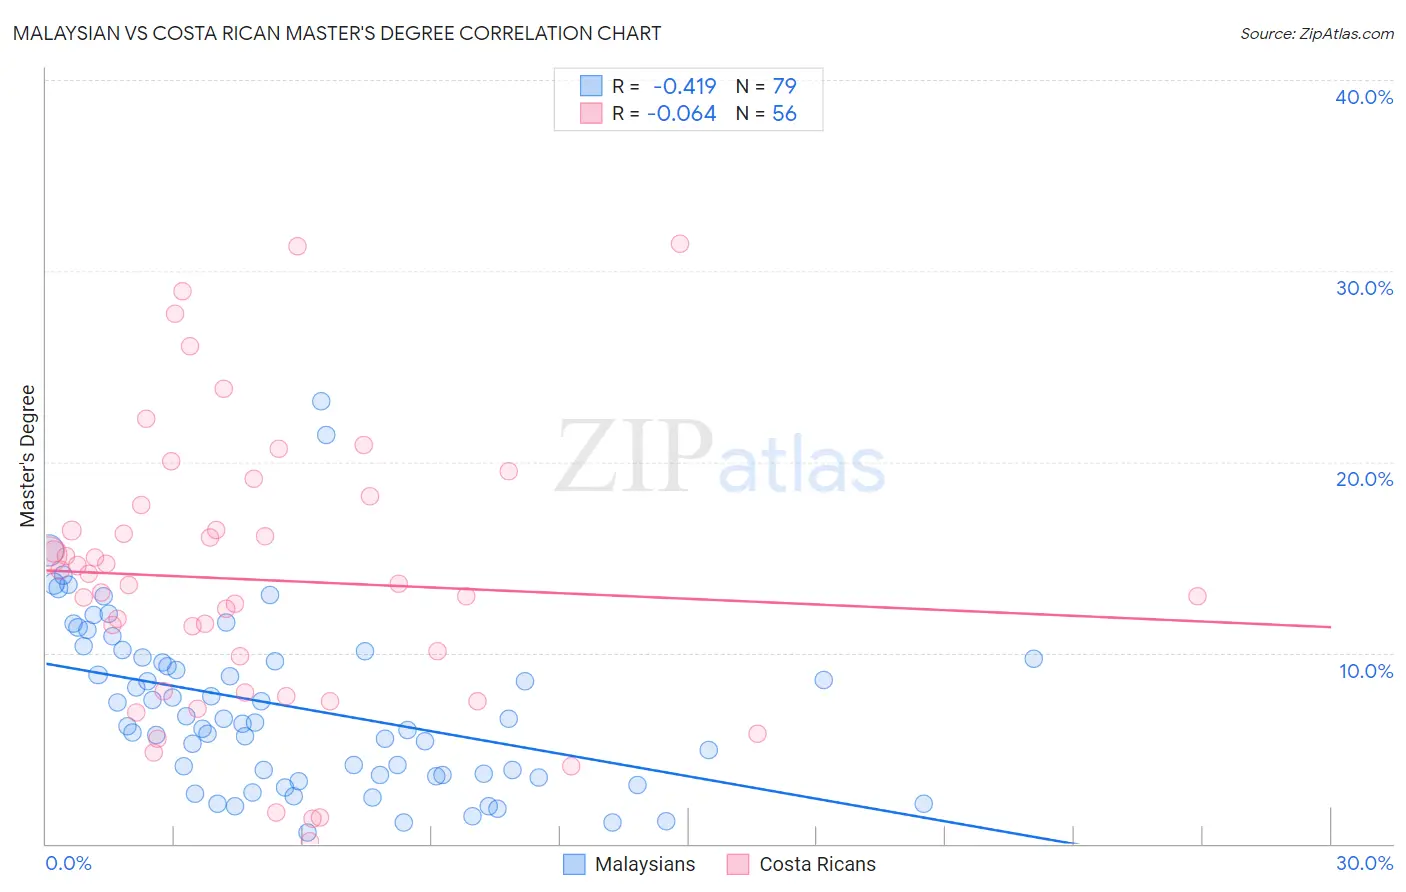
Malaysian vs Costa Rican Master's Degree Correlation Chart
The statistical analysis conducted on geographies consisting of 226,048,565 people shows a moderate negative correlation between the proportion of Malaysians and percentage of population with at least master's degree education in the United States with a correlation coefficient (R) of -0.419 and weighted average of 12.0%. Similarly, the statistical analysis conducted on geographies consisting of 253,588,178 people shows a slight negative correlation between the proportion of Costa Ricans and percentage of population with at least master's degree education in the United States with a correlation coefficient (R) of -0.064 and weighted average of 15.0%, a difference of 24.4%.
Master's Degree Correlation Summary
| Measurement | Malaysian | Costa Rican |
| Minimum | 0.56% | 0.13% |
| Maximum | 23.1% | 31.4% |
| Range | 22.6% | 31.3% |
| Mean | 7.1% | 13.8% |
| Median | 6.4% | 13.6% |
| Interquartile 25% (IQ1) | 3.6% | 8.0% |
| Interquartile 75% (IQ3) | 9.7% | 17.1% |
| Interquartile Range (IQR) | 6.1% | 9.1% |
| Standard Deviation (Sample) | 4.5% | 7.3% |
| Standard Deviation (Population) | 4.5% | 7.2% |
Similar Demographics by Master's Degree
Demographics Similar to Malaysians by Master's Degree
In terms of master's degree, the demographic groups most similar to Malaysians are Immigrants from Dominican Republic (12.1%, a difference of 0.12%), Immigrants from Belize (12.1%, a difference of 0.18%), Immigrants from Caribbean (12.1%, a difference of 0.26%), Potawatomi (12.1%, a difference of 0.26%), and Black/African American (12.1%, a difference of 0.27%).
| Demographics | Rating | Rank | Master's Degree |
| Cape Verdeans | 0.3 /100 | #274 | Tragic 12.1% |
| Cubans | 0.3 /100 | #275 | Tragic 12.1% |
| Blacks/African Americans | 0.3 /100 | #276 | Tragic 12.1% |
| Immigrants | Caribbean | 0.3 /100 | #277 | Tragic 12.1% |
| Potawatomi | 0.3 /100 | #278 | Tragic 12.1% |
| Immigrants | Belize | 0.2 /100 | #279 | Tragic 12.1% |
| Immigrants | Dominican Republic | 0.2 /100 | #280 | Tragic 12.1% |
| Malaysians | 0.2 /100 | #281 | Tragic 12.0% |
| Immigrants | El Salvador | 0.2 /100 | #282 | Tragic 12.0% |
| Hondurans | 0.2 /100 | #283 | Tragic 11.9% |
| Ottawa | 0.2 /100 | #284 | Tragic 11.9% |
| Immigrants | Nicaragua | 0.2 /100 | #285 | Tragic 11.8% |
| Aleuts | 0.1 /100 | #286 | Tragic 11.8% |
| Immigrants | Haiti | 0.1 /100 | #287 | Tragic 11.8% |
| Immigrants | Honduras | 0.1 /100 | #288 | Tragic 11.8% |
Demographics Similar to Costa Ricans by Master's Degree
In terms of master's degree, the demographic groups most similar to Costa Ricans are Immigrants from Uruguay (15.0%, a difference of 0.040%), Immigrants from Ghana (15.0%, a difference of 0.14%), Slovak (14.9%, a difference of 0.32%), Immigrants from Peru (14.9%, a difference of 0.36%), and Irish (15.0%, a difference of 0.50%).
| Demographics | Rating | Rank | Master's Degree |
| Swedes | 66.1 /100 | #166 | Good 15.2% |
| Senegalese | 65.6 /100 | #167 | Good 15.2% |
| Immigrants | North Macedonia | 64.5 /100 | #168 | Good 15.2% |
| Scottish | 62.7 /100 | #169 | Good 15.2% |
| Irish | 56.3 /100 | #170 | Average 15.0% |
| Immigrants | Ghana | 53.6 /100 | #171 | Average 15.0% |
| Immigrants | Uruguay | 52.8 /100 | #172 | Average 15.0% |
| Costa Ricans | 52.5 /100 | #173 | Average 15.0% |
| Slovaks | 50.0 /100 | #174 | Average 14.9% |
| Immigrants | Peru | 49.6 /100 | #175 | Average 14.9% |
| Nigerians | 48.6 /100 | #176 | Average 14.9% |
| Immigrants | Colombia | 48.3 /100 | #177 | Average 14.9% |
| English | 45.0 /100 | #178 | Average 14.8% |
| Immigrants | Iraq | 41.3 /100 | #179 | Average 14.8% |
| Celtics | 41.3 /100 | #180 | Average 14.8% |