Menominee vs Ugandan Doctorate Degree

COMPARE

Menominee
Race
Ancestry
AfghanAfricanAlaska NativeAlaskan AthabascanAlbanianAleutAlsatianAmericanApacheArabArapahoArgentineanArmenianAssyrian/Chaldean/SyriacAustralianAustrianBahamianBangladeshiBarbadianBasqueBelgianBelizeanBermudanBhutaneseBlackfeetBolivianBrazilianBritishBritish West IndianBulgarianBurmeseCajunCambodianCanadianCape VerdeanCarpatho RusynCelticCentral AmericanCentral American IndianCherokeeCheyenneChickasawChileanChineseChippewaChoctawColombianColvilleComancheCosta RicanCreeCreekCroatianCrowCubanCypriotCzechCzechoslovakianDanishDelawareDominicanDutchDutch West IndianEastern EuropeanEcuadorianEgyptianEnglishEstonianEthiopianEuropeanFijianFilipinoFinnishFrenchFrench American IndianFrench CanadianGermanGerman RussianGhanaianGreekGuamanian/ChamorroGuatemalanGuyaneseHaitianHmongHonduranHopiHoumaHungarianIcelanderIndian (Asian)IndonesianInupiatIranianIraqiIrishIroquoisIsraeliItalianJamaicanJapaneseJordanianKenyanKiowaKoreanLaotianLatvianLebaneseLiberianLithuanianLumbeeLuxembourgerMacedonianMalaysianMalteseMarshalleseMenomineeMexicanMexican American IndianMongolianMoroccanNative HawaiianNavajoNepaleseNew ZealanderNicaraguanNigerianNorthern EuropeanNorwegianOkinawanOsageOttawaPaiutePakistaniPalestinianPanamanianParaguayanPennsylvania GermanPeruvianPimaPolishPortuguesePotawatomiPuebloPuerto RicanPuget Sound SalishRomanianRussianSalvadoranSamoanScandinavianScotch-IrishScottishSeminoleSenegaleseSerbianShoshoneSierra LeoneanSiouxSlavicSlovakSloveneSomaliSouth AfricanSouth AmericanSouth American IndianSoviet UnionSpaniardSpanishSpanish AmericanSpanish American IndianSri LankanSubsaharan AfricanSudaneseSwedishSwissSyrianTaiwaneseThaiTlingit-HaidaTohono O'OdhamTonganTrinidadian and TobagonianTsimshianTurkishU.S. Virgin IslanderUkrainianUruguayanUteVenezuelanVietnameseWelshWest IndianYakamaYaquiYugoslavianYumanYup'ikZimbabwean
Immigration
NonimmigrantsImmigrantsAfghanistanAfricaAlbaniaArgentinaArmeniaAsiaAustraliaAustriaBahamasBangladeshBarbadosBelarusBelgiumBelizeBoliviaBosnia and HerzegovinaBrazilBulgariaBurma/MyanmarCabo VerdeCambodiaCameroonCanadaCaribbeanCentral AmericaChileChinaColombiaCongoCosta RicaCroatiaCubaCzechoslovakiaDenmarkDominicaDominican RepublicEastern AfricaEastern AsiaEastern EuropeEcuadorEgyptEl SalvadorEnglandEritreaEthiopiaEuropeFijiFranceGermanyGhanaGreeceGrenadaGuatemalaGuyanaHaitiHondurasHong KongHungaryIndiaIndonesiaIranIraqIrelandIsraelItalyJamaicaJapanJordanKazakhstanKenyaKoreaKuwaitLaosLatin AmericaLatviaLebanonLiberiaLithuaniaMalaysiaMexicoMicronesiaMiddle AfricaMoldovaMoroccoNepalNetherlandsNicaraguaNigeriaNorth AmericaNorth MacedoniaNorthern AfricaNorthern EuropeNorwayOceaniaPakistanPanamaPeruPhilippinesPolandPortugalRomaniaRussiaSaudi ArabiaScotlandSenegalSerbiaSierra LeoneSingaporeSomaliaSouth AfricaSouth AmericaSouth Central AsiaSouth Eastern AsiaSouthern EuropeSpainSri LankaSt. Vincent and the GrenadinesSudanSwedenSwitzerlandSyriaTaiwanThailandTrinidad and TobagoTurkeyUgandaUkraineUruguayUzbekistanVenezuelaVietnamWest IndiesWestern AfricaWestern AsiaWestern EuropeYemenZaireZimbabweAzores
Ugandan
Race
Ancestry
AfghanAfricanAlaska NativeAlaskan AthabascanAlbanianAleutAlsatianAmericanApacheArabArapahoArgentineanArmenianAssyrian/Chaldean/SyriacAustralianAustrianBahamianBangladeshiBarbadianBasqueBelgianBelizeanBermudanBhutaneseBlackfeetBolivianBrazilianBritishBritish West IndianBulgarianBurmeseCajunCambodianCanadianCape VerdeanCarpatho RusynCelticCentral AmericanCentral American IndianCherokeeCheyenneChickasawChileanChineseChippewaChoctawColombianColvilleComancheCosta RicanCreeCreekCroatianCrowCubanCypriotCzechCzechoslovakianDanishDelawareDominicanDutchDutch West IndianEastern EuropeanEcuadorianEgyptianEnglishEstonianEthiopianEuropeanFijianFilipinoFinnishFrenchFrench American IndianFrench CanadianGermanGerman RussianGhanaianGreekGuamanian/ChamorroGuatemalanGuyaneseHaitianHmongHonduranHopiHoumaHungarianIcelanderIndian (Asian)IndonesianInupiatIranianIraqiIrishIroquoisIsraeliItalianJamaicanJapaneseJordanianKenyanKiowaKoreanLaotianLatvianLebaneseLiberianLithuanianLumbeeLuxembourgerMacedonianMalaysianMalteseMarshalleseMexicanMexican American IndianMongolianMoroccanNative HawaiianNavajoNepaleseNew ZealanderNicaraguanNigerianNorthern EuropeanNorwegianOkinawanOsageOttawaPaiutePakistaniPalestinianPanamanianParaguayanPennsylvania GermanPeruvianPimaPolishPortuguesePotawatomiPuebloPuerto RicanPuget Sound SalishRomanianRussianSalvadoranSamoanScandinavianScotch-IrishScottishSeminoleSenegaleseSerbianShoshoneSierra LeoneanSiouxSlavicSlovakSloveneSomaliSouth AfricanSouth AmericanSouth American IndianSoviet UnionSpaniardSpanishSpanish AmericanSpanish American IndianSri LankanSubsaharan AfricanSudaneseSwedishSwissSyrianTaiwaneseThaiTlingit-HaidaTohono O'OdhamTonganTrinidadian and TobagonianTsimshianTurkishU.S. Virgin IslanderUgandanUkrainianUruguayanUteVenezuelanVietnameseWelshWest IndianYakamaYaquiYugoslavianYumanYup'ikZimbabwean
Immigration
NonimmigrantsImmigrantsAfghanistanAfricaAlbaniaArgentinaArmeniaAsiaAustraliaAustriaBahamasBangladeshBarbadosBelarusBelgiumBelizeBoliviaBosnia and HerzegovinaBrazilBulgariaBurma/MyanmarCabo VerdeCambodiaCameroonCanadaCaribbeanCentral AmericaChileChinaColombiaCongoCosta RicaCroatiaCubaCzechoslovakiaDenmarkDominicaDominican RepublicEastern AfricaEastern AsiaEastern EuropeEcuadorEgyptEl SalvadorEnglandEritreaEthiopiaEuropeFijiFranceGermanyGhanaGreeceGrenadaGuatemalaGuyanaHaitiHondurasHong KongHungaryIndiaIndonesiaIranIraqIrelandIsraelItalyJamaicaJapanJordanKazakhstanKenyaKoreaKuwaitLaosLatin AmericaLatviaLebanonLiberiaLithuaniaMalaysiaMexicoMicronesiaMiddle AfricaMoldovaMoroccoNepalNetherlandsNicaraguaNigeriaNorth AmericaNorth MacedoniaNorthern AfricaNorthern EuropeNorwayOceaniaPakistanPanamaPeruPhilippinesPolandPortugalRomaniaRussiaSaudi ArabiaScotlandSenegalSerbiaSierra LeoneSingaporeSomaliaSouth AfricaSouth AmericaSouth Central AsiaSouth Eastern AsiaSouthern EuropeSpainSri LankaSt. Vincent and the GrenadinesSudanSwedenSwitzerlandSyriaTaiwanThailandTrinidad and TobagoTurkeyUgandaUkraineUruguayUzbekistanVenezuelaVietnamWest IndiesWestern AfricaWestern AsiaWestern EuropeYemenZaireZimbabweAzores
Doctorate Degree
Income
Poverty
Unemployment
Labor Participation
Family Structure
Vehicle Availability
Education Level
Disability

Doctorate Degree Comparison

Menominee

Ugandans

Tragic
Exceptional
1.4%
DOCTORATE DEGREE
0.1/ 100
METRIC RATING
313th/ 347
METRIC RANK
2.2%
DOCTORATE DEGREE
99.7/ 100
METRIC RATING
80th/ 347
METRIC RANK

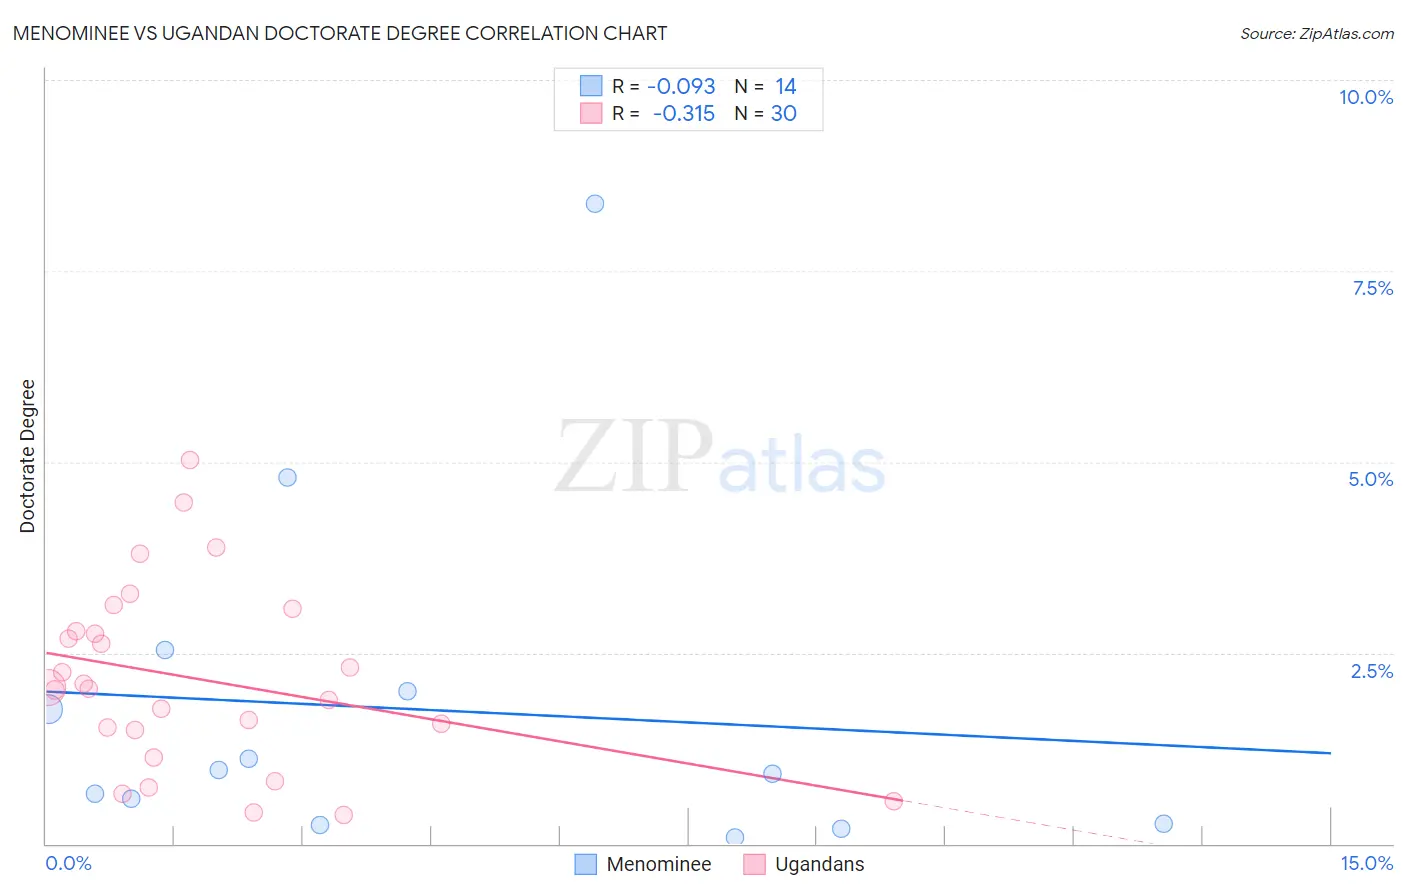
Menominee vs Ugandan Doctorate Degree Correlation Chart

The statistical analysis conducted on geographies consisting of 45,550,616 people shows a slight negative correlation between the proportion of Menominee and percentage of population with at least doctorate degree education in the United States with a correlation coefficient (R) of -0.093 and weighted average of 1.4%. Similarly, the statistical analysis conducted on geographies consisting of 93,908,967 people shows a mild negative correlation between the proportion of Ugandans and percentage of population with at least doctorate degree education in the United States with a correlation coefficient (R) of -0.315 and weighted average of 2.2%, a difference of 64.3%.
Menominee vs Ugandan Doctorate Degree

Doctorate Degree Correlation Summary

MeasurementMenomineeUgandan
Minimum0.087%0.38%
Maximum8.4%5.0%
Range8.3%4.6%
Mean1.8%2.2%
Median0.94%2.0%
Interquartile 25% (IQ1)0.26%1.5%
Interquartile 75% (IQ3)2.0%2.8%
Interquartile Range (IQR)1.7%1.3%
Standard Deviation (Sample)2.3%1.2%
Standard Deviation (Population)2.2%1.2%

Similar Demographics by Doctorate Degree

Demographics Similar to Menominee by Doctorate Degree

In terms of doctorate degree, the demographic groups most similar to Menominee are Dominican (1.4%, a difference of 0.080%), Immigrants from the Azores (1.4%, a difference of 0.10%), Navajo (1.4%, a difference of 0.31%), Immigrants from Nicaragua (1.4%, a difference of 0.32%), and Immigrants from Micronesia (1.3%, a difference of 0.55%).
DemographicsRating | RankDoctorate Degree
Guyanese
0.1
/100
|
#306
Tragic
1.4%
Cubans
0.1
/100
|
#307
Tragic
1.4%
Immigrants | Laos
0.1
/100
|
#308
Tragic
1.4%
Immigrants | Grenada
0.1
/100
|
#309
Tragic
1.4%
Immigrants | Jamaica
0.1
/100
|
#310
Tragic
1.4%
Immigrants | Honduras
0.1
/100
|
#311
Tragic
1.4%
Immigrants | Nicaragua
0.1
/100
|
#312
Tragic
1.4%
Menominee
0.1
/100
|
#313
Tragic
1.4%
Dominicans
0.1
/100
|
#314
Tragic
1.4%
Immigrants | Azores
0.1
/100
|
#315
Tragic
1.4%
Navajo
0.1
/100
|
#316
Tragic
1.4%
Immigrants | Micronesia
0.1
/100
|
#317
Tragic
1.3%
Creek
0.1
/100
|
#318
Tragic
1.3%
Immigrants | Guyana
0.1
/100
|
#319
Tragic
1.3%
Immigrants | St. Vincent and the Grenadines
0.1
/100
|
#320
Tragic
1.3%

Demographics Similar to Ugandans by Doctorate Degree

In terms of doctorate degree, the demographic groups most similar to Ugandans are Immigrants from Argentina (2.2%, a difference of 0.050%), Northern European (2.2%, a difference of 0.28%), Immigrants from Belarus (2.2%, a difference of 0.35%), Immigrants from Uganda (2.2%, a difference of 0.59%), and Immigrants from Lithuania (2.2%, a difference of 0.77%).
DemographicsRating | RankDoctorate Degree
Immigrants | Bulgaria
99.8
/100
|
#73
Exceptional
2.3%
Immigrants | North America
99.8
/100
|
#74
Exceptional
2.2%
Immigrants | Western Asia
99.8
/100
|
#75
Exceptional
2.2%
Immigrants | Hungary
99.8
/100
|
#76
Exceptional
2.2%
Immigrants | Lebanon
99.8
/100
|
#77
Exceptional
2.2%
Immigrants | Belarus
99.7
/100
|
#78
Exceptional
2.2%
Northern Europeans
99.7
/100
|
#79
Exceptional
2.2%
Ugandans
99.7
/100
|
#80
Exceptional
2.2%
Immigrants | Argentina
99.7
/100
|
#81
Exceptional
2.2%
Immigrants | Uganda
99.6
/100
|
#82
Exceptional
2.2%
Immigrants | Lithuania
99.6
/100
|
#83
Exceptional
2.2%
Immigrants | England
99.6
/100
|
#84
Exceptional
2.2%
Immigrants | Brazil
99.6
/100
|
#85
Exceptional
2.2%
Egyptians
99.4
/100
|
#86
Exceptional
2.2%
Immigrants | Zimbabwe
99.4
/100
|
#87
Exceptional
2.2%