Macedonian vs Immigrants from Bosnia and Herzegovina Doctorate Degree
COMPARE
Macedonian
Immigrants from Bosnia and Herzegovina
Doctorate Degree
Doctorate Degree Comparison
Macedonians
Immigrants from Bosnia and Herzegovina
1.9%
DOCTORATE DEGREE
60.9/ 100
METRIC RATING
167th/ 347
METRIC RANK
1.7%
DOCTORATE DEGREE
7.8/ 100
METRIC RATING
223rd/ 347
METRIC RANK
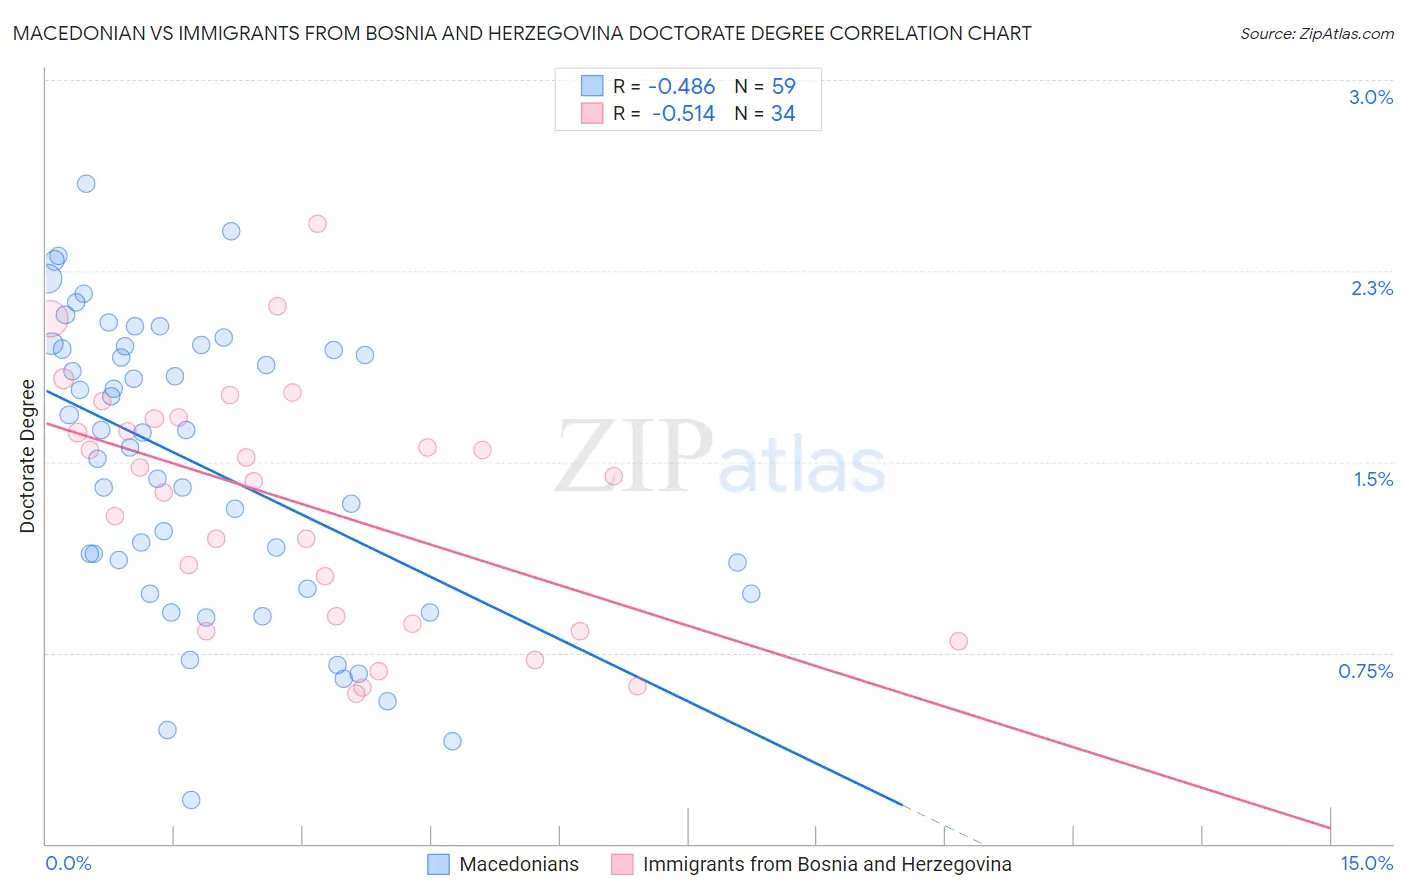
Macedonian vs Immigrants from Bosnia and Herzegovina Doctorate Degree Correlation Chart
The statistical analysis conducted on geographies consisting of 132,009,126 people shows a moderate negative correlation between the proportion of Macedonians and percentage of population with at least doctorate degree education in the United States with a correlation coefficient (R) of -0.486 and weighted average of 1.9%. Similarly, the statistical analysis conducted on geographies consisting of 156,366,031 people shows a substantial negative correlation between the proportion of Immigrants from Bosnia and Herzegovina and percentage of population with at least doctorate degree education in the United States with a correlation coefficient (R) of -0.514 and weighted average of 1.7%, a difference of 11.7%.
Doctorate Degree Correlation Summary
| Measurement | Macedonian | Immigrants from Bosnia and Herzegovina |
| Minimum | 0.17% | 0.59% |
| Maximum | 2.6% | 2.4% |
| Range | 2.4% | 1.8% |
| Mean | 1.5% | 1.3% |
| Median | 1.6% | 1.4% |
| Interquartile 25% (IQ1) | 1.0% | 0.86% |
| Interquartile 75% (IQ3) | 2.0% | 1.7% |
| Interquartile Range (IQR) | 0.95% | 0.81% |
| Standard Deviation (Sample) | 0.57% | 0.48% |
| Standard Deviation (Population) | 0.57% | 0.47% |
Similar Demographics by Doctorate Degree
Demographics Similar to Macedonians by Doctorate Degree
In terms of doctorate degree, the demographic groups most similar to Macedonians are Sri Lankan (1.9%, a difference of 0.10%), Spaniard (1.9%, a difference of 0.39%), Scotch-Irish (1.9%, a difference of 0.41%), Celtic (1.9%, a difference of 0.90%), and Vietnamese (1.9%, a difference of 0.92%).
| Demographics | Rating | Rank | Doctorate Degree |
| Welsh | 69.7 /100 | #160 | Good 1.9% |
| Immigrants | Middle Africa | 68.8 /100 | #161 | Good 1.9% |
| Irish | 67.5 /100 | #162 | Good 1.9% |
| Czechs | 67.3 /100 | #163 | Good 1.9% |
| Celtics | 66.7 /100 | #164 | Good 1.9% |
| Scotch-Irish | 63.6 /100 | #165 | Good 1.9% |
| Spaniards | 63.5 /100 | #166 | Good 1.9% |
| Macedonians | 60.9 /100 | #167 | Good 1.9% |
| Sri Lankans | 60.3 /100 | #168 | Good 1.9% |
| Vietnamese | 54.8 /100 | #169 | Average 1.9% |
| Costa Ricans | 53.3 /100 | #170 | Average 1.8% |
| Bermudans | 52.1 /100 | #171 | Average 1.8% |
| Belgians | 50.3 /100 | #172 | Average 1.8% |
| Norwegians | 50.0 /100 | #173 | Average 1.8% |
| Immigrants | Bangladesh | 50.0 /100 | #174 | Average 1.8% |
Demographics Similar to Immigrants from Bosnia and Herzegovina by Doctorate Degree
In terms of doctorate degree, the demographic groups most similar to Immigrants from Bosnia and Herzegovina are Immigrants from Poland (1.7%, a difference of 0.22%), Immigrants from Venezuela (1.7%, a difference of 0.46%), Nonimmigrants (1.7%, a difference of 0.53%), Immigrants from Colombia (1.7%, a difference of 0.71%), and Immigrants from Uruguay (1.7%, a difference of 0.72%).
| Demographics | Rating | Rank | Doctorate Degree |
| Immigrants | Burma/Myanmar | 13.5 /100 | #216 | Poor 1.7% |
| Spanish Americans | 12.9 /100 | #217 | Poor 1.7% |
| Tlingit-Haida | 11.9 /100 | #218 | Poor 1.7% |
| Immigrants | Iraq | 10.7 /100 | #219 | Poor 1.7% |
| Immigrants | Uruguay | 9.2 /100 | #220 | Tragic 1.7% |
| Immigrants | Nonimmigrants | 8.8 /100 | #221 | Tragic 1.7% |
| Immigrants | Venezuela | 8.7 /100 | #222 | Tragic 1.7% |
| Immigrants | Bosnia and Herzegovina | 7.8 /100 | #223 | Tragic 1.7% |
| Immigrants | Poland | 7.4 /100 | #224 | Tragic 1.7% |
| Immigrants | Colombia | 6.7 /100 | #225 | Tragic 1.7% |
| Osage | 6.5 /100 | #226 | Tragic 1.7% |
| Panamanians | 6.3 /100 | #227 | Tragic 1.7% |
| Assyrians/Chaldeans/Syriacs | 5.9 /100 | #228 | Tragic 1.7% |
| Colville | 4.7 /100 | #229 | Tragic 1.6% |
| Immigrants | Philippines | 4.3 /100 | #230 | Tragic 1.6% |