Macedonian vs Immigrants from Austria Doctorate Degree
COMPARE
Macedonian
Immigrants from Austria
Doctorate Degree
Doctorate Degree Comparison
Macedonians
Immigrants from Austria
1.9%
DOCTORATE DEGREE
60.9/ 100
METRIC RATING
167th/ 347
METRIC RANK
2.4%
DOCTORATE DEGREE
100.0/ 100
METRIC RATING
46th/ 347
METRIC RANK
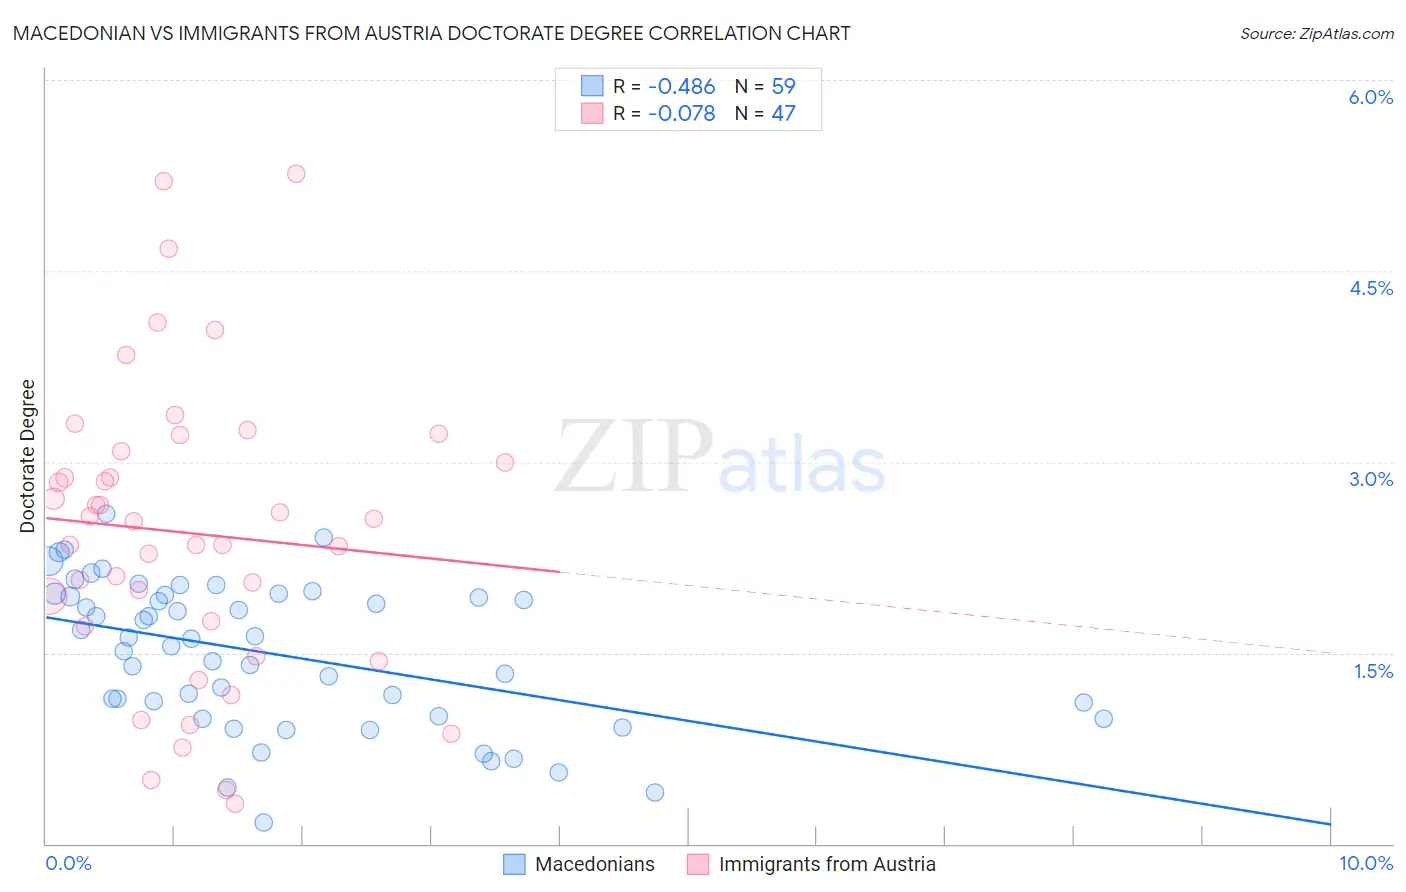
Macedonian vs Immigrants from Austria Doctorate Degree Correlation Chart
The statistical analysis conducted on geographies consisting of 132,009,126 people shows a moderate negative correlation between the proportion of Macedonians and percentage of population with at least doctorate degree education in the United States with a correlation coefficient (R) of -0.486 and weighted average of 1.9%. Similarly, the statistical analysis conducted on geographies consisting of 167,487,271 people shows a slight negative correlation between the proportion of Immigrants from Austria and percentage of population with at least doctorate degree education in the United States with a correlation coefficient (R) of -0.078 and weighted average of 2.4%, a difference of 30.6%.
Doctorate Degree Correlation Summary
| Measurement | Macedonian | Immigrants from Austria |
| Minimum | 0.17% | 0.31% |
| Maximum | 2.6% | 5.3% |
| Range | 2.4% | 4.9% |
| Mean | 1.5% | 2.4% |
| Median | 1.6% | 2.5% |
| Interquartile 25% (IQ1) | 1.0% | 1.7% |
| Interquartile 75% (IQ3) | 2.0% | 3.1% |
| Interquartile Range (IQR) | 0.95% | 1.4% |
| Standard Deviation (Sample) | 0.57% | 1.2% |
| Standard Deviation (Population) | 0.57% | 1.1% |
Similar Demographics by Doctorate Degree
Demographics Similar to Macedonians by Doctorate Degree
In terms of doctorate degree, the demographic groups most similar to Macedonians are Sri Lankan (1.9%, a difference of 0.10%), Spaniard (1.9%, a difference of 0.39%), Scotch-Irish (1.9%, a difference of 0.41%), Celtic (1.9%, a difference of 0.90%), and Vietnamese (1.9%, a difference of 0.92%).
| Demographics | Rating | Rank | Doctorate Degree |
| Welsh | 69.7 /100 | #160 | Good 1.9% |
| Immigrants | Middle Africa | 68.8 /100 | #161 | Good 1.9% |
| Irish | 67.5 /100 | #162 | Good 1.9% |
| Czechs | 67.3 /100 | #163 | Good 1.9% |
| Celtics | 66.7 /100 | #164 | Good 1.9% |
| Scotch-Irish | 63.6 /100 | #165 | Good 1.9% |
| Spaniards | 63.5 /100 | #166 | Good 1.9% |
| Macedonians | 60.9 /100 | #167 | Good 1.9% |
| Sri Lankans | 60.3 /100 | #168 | Good 1.9% |
| Vietnamese | 54.8 /100 | #169 | Average 1.9% |
| Costa Ricans | 53.3 /100 | #170 | Average 1.8% |
| Bermudans | 52.1 /100 | #171 | Average 1.8% |
| Belgians | 50.3 /100 | #172 | Average 1.8% |
| Norwegians | 50.0 /100 | #173 | Average 1.8% |
| Immigrants | Bangladesh | 50.0 /100 | #174 | Average 1.8% |
Demographics Similar to Immigrants from Austria by Doctorate Degree
In terms of doctorate degree, the demographic groups most similar to Immigrants from Austria are Immigrants from South Africa (2.4%, a difference of 0.14%), Immigrants from Western Europe (2.4%, a difference of 0.22%), Asian (2.4%, a difference of 0.44%), Immigrants from Asia (2.4%, a difference of 0.57%), and Immigrants from Netherlands (2.5%, a difference of 1.7%).
| Demographics | Rating | Rank | Doctorate Degree |
| Immigrants | Ireland | 100.0 /100 | #39 | Exceptional 2.5% |
| Estonians | 100.0 /100 | #40 | Exceptional 2.5% |
| Immigrants | Russia | 100.0 /100 | #41 | Exceptional 2.5% |
| New Zealanders | 100.0 /100 | #42 | Exceptional 2.5% |
| Soviet Union | 100.0 /100 | #43 | Exceptional 2.5% |
| Immigrants | Netherlands | 100.0 /100 | #44 | Exceptional 2.5% |
| Immigrants | South Africa | 100.0 /100 | #45 | Exceptional 2.4% |
| Immigrants | Austria | 100.0 /100 | #46 | Exceptional 2.4% |
| Immigrants | Western Europe | 100.0 /100 | #47 | Exceptional 2.4% |
| Asians | 100.0 /100 | #48 | Exceptional 2.4% |
| Immigrants | Asia | 100.0 /100 | #49 | Exceptional 2.4% |
| Immigrants | Norway | 100.0 /100 | #50 | Exceptional 2.4% |
| Australians | 100.0 /100 | #51 | Exceptional 2.4% |
| Bulgarians | 100.0 /100 | #52 | Exceptional 2.4% |
| Immigrants | Latvia | 100.0 /100 | #53 | Exceptional 2.4% |