Macedonian vs Immigrants from Syria 10th Grade
COMPARE
Macedonian
Immigrants from Syria
10th Grade
10th Grade Comparison
Macedonians
Immigrants from Syria
95.2%
10TH GRADE
99.9/ 100
METRIC RATING
43rd/ 347
METRIC RANK
93.4%
10TH GRADE
19.4/ 100
METRIC RATING
208th/ 347
METRIC RANK
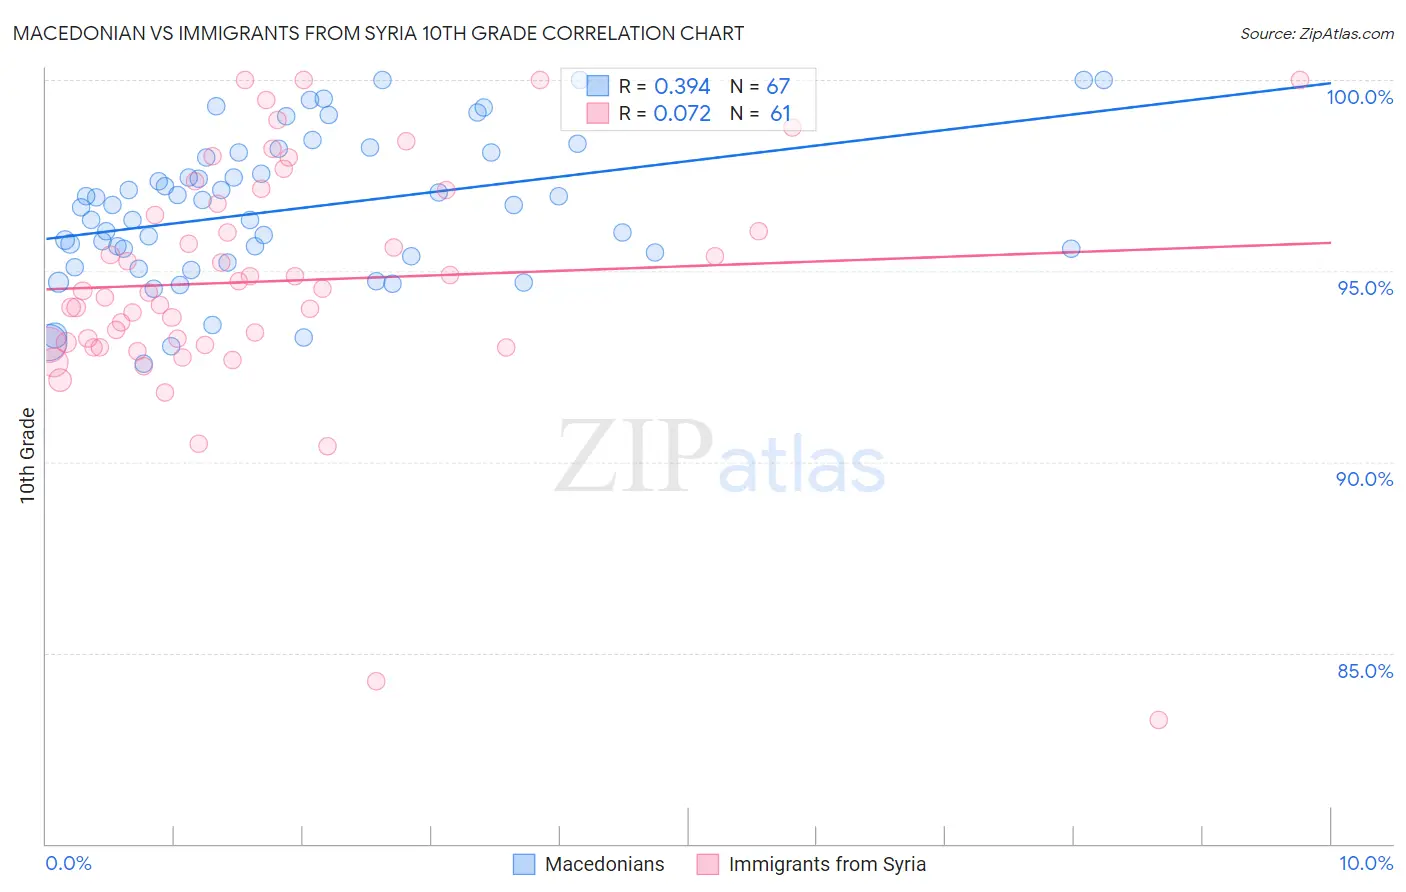
Macedonian vs Immigrants from Syria 10th Grade Correlation Chart
The statistical analysis conducted on geographies consisting of 132,581,663 people shows a mild positive correlation between the proportion of Macedonians and percentage of population with at least 10th grade education in the United States with a correlation coefficient (R) of 0.394 and weighted average of 95.2%. Similarly, the statistical analysis conducted on geographies consisting of 174,108,882 people shows a slight positive correlation between the proportion of Immigrants from Syria and percentage of population with at least 10th grade education in the United States with a correlation coefficient (R) of 0.072 and weighted average of 93.4%, a difference of 1.8%.
10th Grade Correlation Summary
| Measurement | Macedonian | Immigrants from Syria |
| Minimum | 92.6% | 83.2% |
| Maximum | 100.0% | 100.0% |
| Range | 7.4% | 16.8% |
| Mean | 96.6% | 94.7% |
| Median | 96.7% | 94.5% |
| Interquartile 25% (IQ1) | 95.4% | 93.1% |
| Interquartile 75% (IQ3) | 98.1% | 96.9% |
| Interquartile Range (IQR) | 2.7% | 3.9% |
| Standard Deviation (Sample) | 1.9% | 3.2% |
| Standard Deviation (Population) | 1.9% | 3.1% |
Similar Demographics by 10th Grade
Demographics Similar to Macedonians by 10th Grade
In terms of 10th grade, the demographic groups most similar to Macedonians are Immigrants from Northern Europe (95.2%, a difference of 0.010%), Greek (95.2%, a difference of 0.010%), Slavic (95.2%, a difference of 0.020%), Czechoslovakian (95.1%, a difference of 0.020%), and Serbian (95.1%, a difference of 0.030%).
| Demographics | Rating | Rank | 10th Grade |
| Immigrants | India | 99.9 /100 | #36 | Exceptional 95.3% |
| French Canadians | 99.9 /100 | #37 | Exceptional 95.3% |
| Northern Europeans | 99.9 /100 | #38 | Exceptional 95.3% |
| Immigrants | Scotland | 99.9 /100 | #39 | Exceptional 95.2% |
| Scotch-Irish | 99.9 /100 | #40 | Exceptional 95.2% |
| Russians | 99.9 /100 | #41 | Exceptional 95.2% |
| Slavs | 99.9 /100 | #42 | Exceptional 95.2% |
| Macedonians | 99.9 /100 | #43 | Exceptional 95.2% |
| Immigrants | Northern Europe | 99.9 /100 | #44 | Exceptional 95.2% |
| Greeks | 99.9 /100 | #45 | Exceptional 95.2% |
| Czechoslovakians | 99.9 /100 | #46 | Exceptional 95.1% |
| Serbians | 99.9 /100 | #47 | Exceptional 95.1% |
| Australians | 99.9 /100 | #48 | Exceptional 95.1% |
| Immigrants | Austria | 99.9 /100 | #49 | Exceptional 95.1% |
| Immigrants | Canada | 99.8 /100 | #50 | Exceptional 95.1% |
Demographics Similar to Immigrants from Syria by 10th Grade
In terms of 10th grade, the demographic groups most similar to Immigrants from Syria are Samoan (93.4%, a difference of 0.0%), Ute (93.4%, a difference of 0.010%), Immigrants from Indonesia (93.4%, a difference of 0.010%), Immigrants from Sudan (93.4%, a difference of 0.010%), and Immigrants from Chile (93.4%, a difference of 0.010%).
| Demographics | Rating | Rank | 10th Grade |
| Hawaiians | 21.8 /100 | #201 | Fair 93.5% |
| Immigrants | Uganda | 20.9 /100 | #202 | Fair 93.5% |
| Immigrants | Western Asia | 20.6 /100 | #203 | Fair 93.4% |
| Ute | 20.3 /100 | #204 | Fair 93.4% |
| Immigrants | Indonesia | 20.2 /100 | #205 | Fair 93.4% |
| Immigrants | Sudan | 20.0 /100 | #206 | Fair 93.4% |
| Samoans | 19.5 /100 | #207 | Poor 93.4% |
| Immigrants | Syria | 19.4 /100 | #208 | Poor 93.4% |
| Immigrants | Chile | 18.8 /100 | #209 | Poor 93.4% |
| Indians (Asian) | 17.6 /100 | #210 | Poor 93.4% |
| Cajuns | 16.9 /100 | #211 | Poor 93.4% |
| Immigrants | Zaire | 16.7 /100 | #212 | Poor 93.4% |
| Immigrants | Asia | 15.7 /100 | #213 | Poor 93.4% |
| Immigrants | Bahamas | 15.2 /100 | #214 | Poor 93.4% |
| Immigrants | Oceania | 15.1 /100 | #215 | Poor 93.4% |