Yakama vs Immigrants from Syria Bachelor's Degree
COMPARE
Yakama
Immigrants from Syria
Bachelor's Degree
Bachelor's Degree Comparison
Yakama
Immigrants from Syria
24.5%
BACHELOR'S DEGREE
0.0/ 100
METRIC RATING
342nd/ 347
METRIC RANK
40.5%
BACHELOR'S DEGREE
94.9/ 100
METRIC RATING
119th/ 347
METRIC RANK
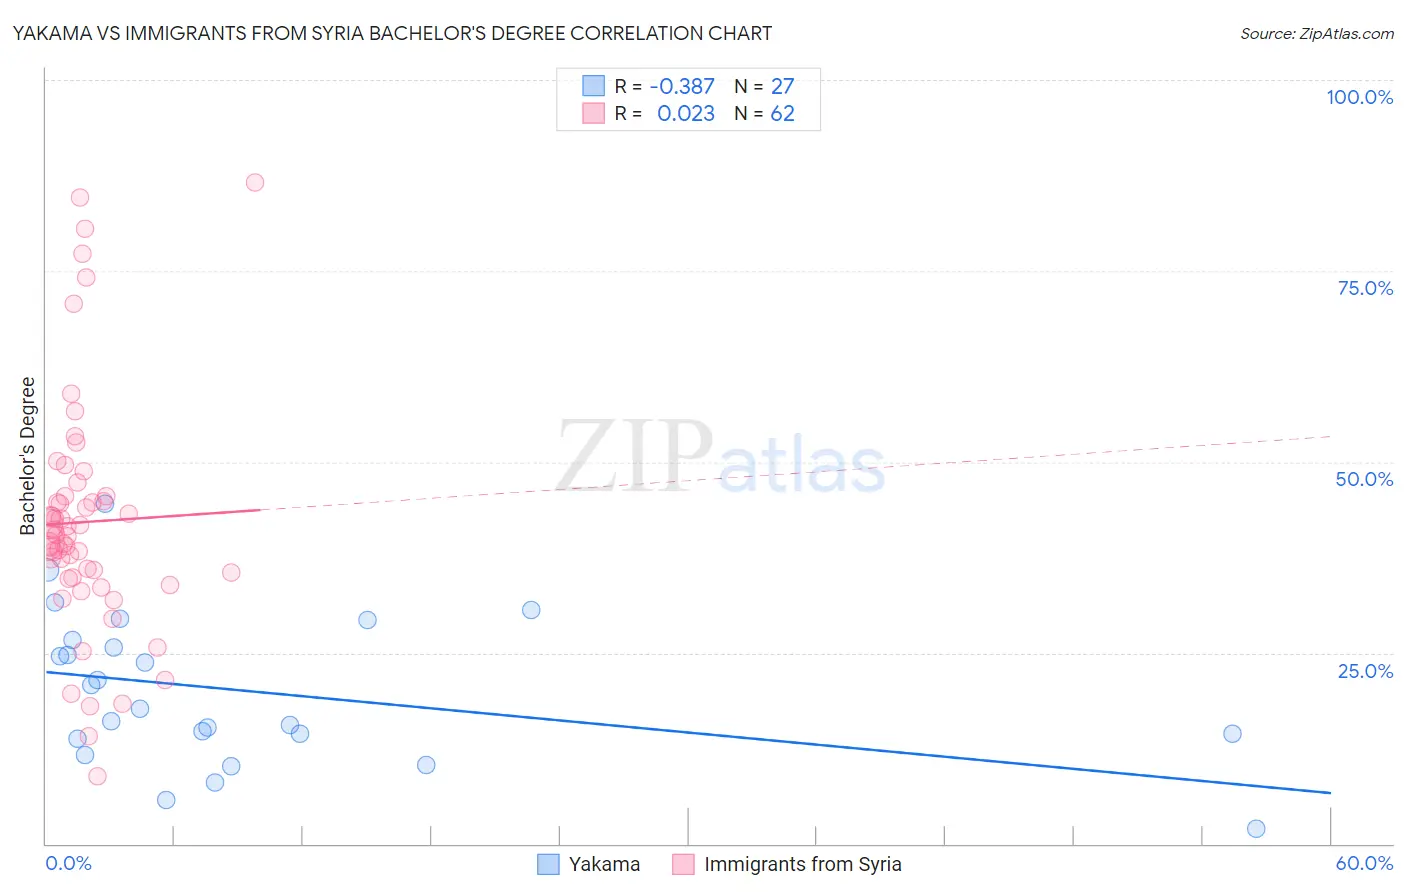
Yakama vs Immigrants from Syria Bachelor's Degree Correlation Chart
The statistical analysis conducted on geographies consisting of 19,923,144 people shows a mild negative correlation between the proportion of Yakama and percentage of population with at least bachelor's degree education in the United States with a correlation coefficient (R) of -0.387 and weighted average of 24.5%. Similarly, the statistical analysis conducted on geographies consisting of 174,109,130 people shows no correlation between the proportion of Immigrants from Syria and percentage of population with at least bachelor's degree education in the United States with a correlation coefficient (R) of 0.023 and weighted average of 40.5%, a difference of 65.6%.
Bachelor's Degree Correlation Summary
| Measurement | Yakama | Immigrants from Syria |
| Minimum | 1.9% | 8.8% |
| Maximum | 44.4% | 86.6% |
| Range | 42.5% | 77.8% |
| Mean | 19.9% | 42.1% |
| Median | 17.6% | 40.3% |
| Interquartile 25% (IQ1) | 13.8% | 34.9% |
| Interquartile 75% (IQ3) | 26.6% | 45.5% |
| Interquartile Range (IQR) | 12.8% | 10.5% |
| Standard Deviation (Sample) | 9.9% | 15.6% |
| Standard Deviation (Population) | 9.7% | 15.5% |
Similar Demographics by Bachelor's Degree
Demographics Similar to Yakama by Bachelor's Degree
In terms of bachelor's degree, the demographic groups most similar to Yakama are Tohono O'odham (24.4%, a difference of 0.20%), Yuman (24.5%, a difference of 0.27%), Lumbee (24.8%, a difference of 1.2%), Hopi (25.3%, a difference of 3.4%), and Navajo (23.6%, a difference of 3.6%).
| Demographics | Rating | Rank | Bachelor's Degree |
| Mexicans | 0.0 /100 | #333 | Tragic 27.1% |
| Arapaho | 0.0 /100 | #334 | Tragic 26.6% |
| Natives/Alaskans | 0.0 /100 | #335 | Tragic 26.3% |
| Immigrants | Mexico | 0.0 /100 | #336 | Tragic 26.1% |
| Inupiat | 0.0 /100 | #337 | Tragic 25.8% |
| Pueblo | 0.0 /100 | #338 | Tragic 25.5% |
| Hopi | 0.0 /100 | #339 | Tragic 25.3% |
| Lumbee | 0.0 /100 | #340 | Tragic 24.8% |
| Yuman | 0.0 /100 | #341 | Tragic 24.5% |
| Yakama | 0.0 /100 | #342 | Tragic 24.5% |
| Tohono O'odham | 0.0 /100 | #343 | Tragic 24.4% |
| Navajo | 0.0 /100 | #344 | Tragic 23.6% |
| Pima | 0.0 /100 | #345 | Tragic 23.2% |
| Houma | 0.0 /100 | #346 | Tragic 21.4% |
| Yup'ik | 0.0 /100 | #347 | Tragic 19.4% |
Demographics Similar to Immigrants from Syria by Bachelor's Degree
In terms of bachelor's degree, the demographic groups most similar to Immigrants from Syria are Venezuelan (40.5%, a difference of 0.070%), Moroccan (40.5%, a difference of 0.12%), Immigrants from Albania (40.4%, a difference of 0.22%), Lebanese (40.4%, a difference of 0.24%), and Immigrants from Eritrea (40.4%, a difference of 0.24%).
| Demographics | Rating | Rank | Bachelor's Degree |
| Ugandans | 96.3 /100 | #112 | Exceptional 40.8% |
| Brazilians | 96.3 /100 | #113 | Exceptional 40.8% |
| Afghans | 96.2 /100 | #114 | Exceptional 40.8% |
| Palestinians | 95.8 /100 | #115 | Exceptional 40.7% |
| Immigrants | Uganda | 95.7 /100 | #116 | Exceptional 40.7% |
| Austrians | 95.5 /100 | #117 | Exceptional 40.6% |
| Croatians | 95.5 /100 | #118 | Exceptional 40.6% |
| Immigrants | Syria | 94.9 /100 | #119 | Exceptional 40.5% |
| Venezuelans | 94.7 /100 | #120 | Exceptional 40.5% |
| Moroccans | 94.6 /100 | #121 | Exceptional 40.5% |
| Immigrants | Albania | 94.4 /100 | #122 | Exceptional 40.4% |
| Lebanese | 94.3 /100 | #123 | Exceptional 40.4% |
| Immigrants | Eritrea | 94.3 /100 | #124 | Exceptional 40.4% |
| British | 94.2 /100 | #125 | Exceptional 40.4% |
| Immigrants | Eastern Africa | 94.1 /100 | #126 | Exceptional 40.4% |