German vs Immigrants from Saudi Arabia Bachelor's Degree
COMPARE
German
Immigrants from Saudi Arabia
Bachelor's Degree
Bachelor's Degree Comparison
Germans
Immigrants from Saudi Arabia
36.1%
BACHELOR'S DEGREE
13.9/ 100
METRIC RATING
214th/ 347
METRIC RANK
44.8%
BACHELOR'S DEGREE
100.0/ 100
METRIC RATING
42nd/ 347
METRIC RANK
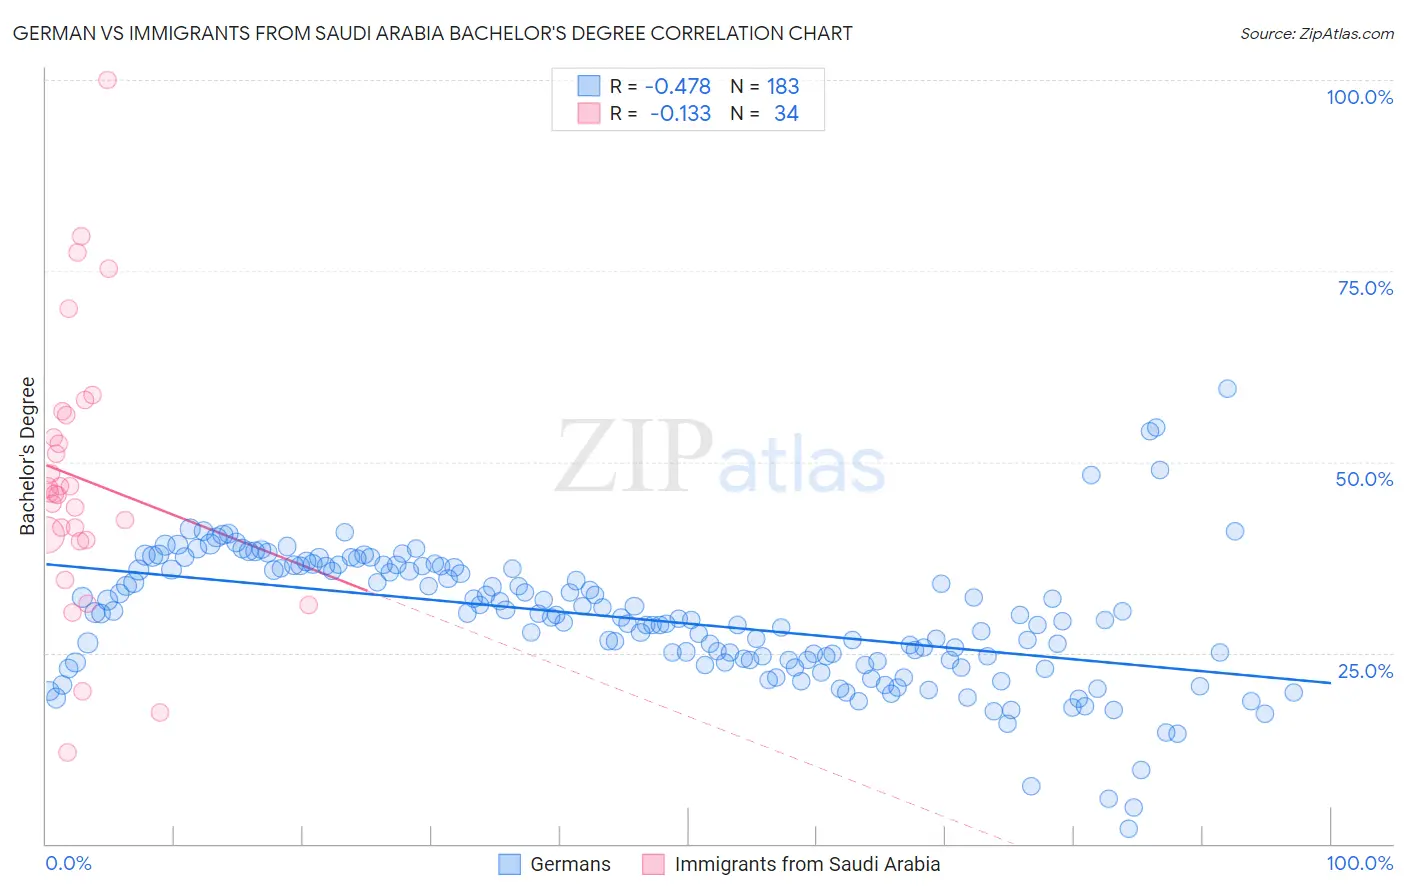
German vs Immigrants from Saudi Arabia Bachelor's Degree Correlation Chart
The statistical analysis conducted on geographies consisting of 580,976,165 people shows a moderate negative correlation between the proportion of Germans and percentage of population with at least bachelor's degree education in the United States with a correlation coefficient (R) of -0.478 and weighted average of 36.1%. Similarly, the statistical analysis conducted on geographies consisting of 164,289,450 people shows a poor negative correlation between the proportion of Immigrants from Saudi Arabia and percentage of population with at least bachelor's degree education in the United States with a correlation coefficient (R) of -0.133 and weighted average of 44.8%, a difference of 24.0%.
Bachelor's Degree Correlation Summary
| Measurement | German | Immigrants from Saudi Arabia |
| Minimum | 2.0% | 11.9% |
| Maximum | 59.5% | 100.0% |
| Range | 57.6% | 88.1% |
| Mean | 29.5% | 47.8% |
| Median | 29.6% | 45.9% |
| Interquartile 25% (IQ1) | 23.8% | 39.7% |
| Interquartile 75% (IQ3) | 36.2% | 56.1% |
| Interquartile Range (IQR) | 12.3% | 16.4% |
| Standard Deviation (Sample) | 8.7% | 18.0% |
| Standard Deviation (Population) | 8.7% | 17.7% |
Similar Demographics by Bachelor's Degree
Demographics Similar to Germans by Bachelor's Degree
In terms of bachelor's degree, the demographic groups most similar to Germans are Immigrants from Western Africa (36.1%, a difference of 0.030%), Immigrants from Panama (36.2%, a difference of 0.060%), Barbadian (36.1%, a difference of 0.090%), Immigrants from Philippines (36.4%, a difference of 0.75%), and Scotch-Irish (36.4%, a difference of 0.83%).
| Demographics | Rating | Rank | Bachelor's Degree |
| Immigrants | Middle Africa | 20.6 /100 | #207 | Fair 36.6% |
| Immigrants | Thailand | 19.4 /100 | #208 | Poor 36.5% |
| Panamanians | 18.8 /100 | #209 | Poor 36.5% |
| French | 18.6 /100 | #210 | Poor 36.5% |
| Scotch-Irish | 18.3 /100 | #211 | Poor 36.4% |
| Immigrants | Philippines | 17.8 /100 | #212 | Poor 36.4% |
| Immigrants | Panama | 14.2 /100 | #213 | Poor 36.2% |
| Germans | 13.9 /100 | #214 | Poor 36.1% |
| Immigrants | Western Africa | 13.8 /100 | #215 | Poor 36.1% |
| Barbadians | 13.5 /100 | #216 | Poor 36.1% |
| German Russians | 10.2 /100 | #217 | Poor 35.8% |
| Sub-Saharan Africans | 9.8 /100 | #218 | Tragic 35.8% |
| West Indians | 9.7 /100 | #219 | Tragic 35.8% |
| Spanish | 9.6 /100 | #220 | Tragic 35.8% |
| Dutch | 9.2 /100 | #221 | Tragic 35.7% |
Demographics Similar to Immigrants from Saudi Arabia by Bachelor's Degree
In terms of bachelor's degree, the demographic groups most similar to Immigrants from Saudi Arabia are Immigrants from South Africa (44.8%, a difference of 0.14%), Immigrants from Malaysia (45.0%, a difference of 0.38%), Immigrants from Belarus (45.0%, a difference of 0.42%), Immigrants from Lithuania (44.6%, a difference of 0.49%), and Immigrants from Kuwait (44.6%, a difference of 0.52%).
| Demographics | Rating | Rank | Bachelor's Degree |
| Immigrants | Russia | 100.0 /100 | #35 | Exceptional 45.4% |
| Mongolians | 100.0 /100 | #36 | Exceptional 45.4% |
| Russians | 100.0 /100 | #37 | Exceptional 45.3% |
| Bulgarians | 100.0 /100 | #38 | Exceptional 45.3% |
| Immigrants | Latvia | 100.0 /100 | #39 | Exceptional 45.1% |
| Immigrants | Belarus | 100.0 /100 | #40 | Exceptional 45.0% |
| Immigrants | Malaysia | 100.0 /100 | #41 | Exceptional 45.0% |
| Immigrants | Saudi Arabia | 100.0 /100 | #42 | Exceptional 44.8% |
| Immigrants | South Africa | 99.9 /100 | #43 | Exceptional 44.8% |
| Immigrants | Lithuania | 99.9 /100 | #44 | Exceptional 44.6% |
| Immigrants | Kuwait | 99.9 /100 | #45 | Exceptional 44.6% |
| Immigrants | Bulgaria | 99.9 /100 | #46 | Exceptional 44.6% |
| Bolivians | 99.9 /100 | #47 | Exceptional 44.6% |
| Estonians | 99.9 /100 | #48 | Exceptional 44.6% |
| Immigrants | Norway | 99.9 /100 | #49 | Exceptional 44.5% |