Luxembourger vs Thai College, Under 1 year
COMPARE
Luxembourger
Thai
College, Under 1 year
College, Under 1 year Comparison
Luxembourgers
Thais
68.2%
COLLEGE, UNDER 1 YEAR
98.1/ 100
METRIC RATING
92nd/ 347
METRIC RANK
73.4%
COLLEGE, UNDER 1 YEAR
100.0/ 100
METRIC RATING
8th/ 347
METRIC RANK
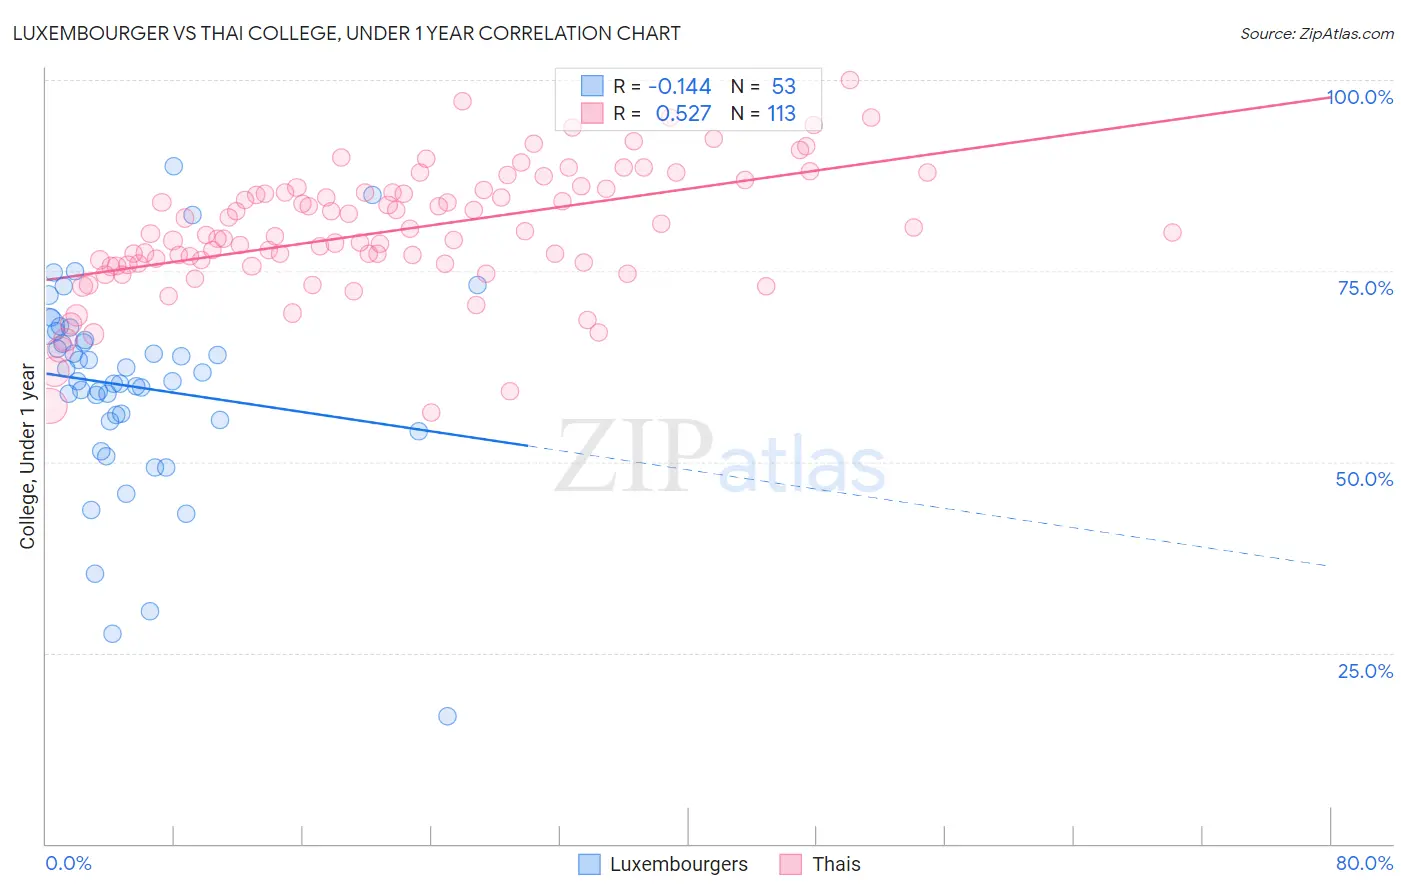
Luxembourger vs Thai College, Under 1 year Correlation Chart
The statistical analysis conducted on geographies consisting of 144,676,190 people shows a poor negative correlation between the proportion of Luxembourgers and percentage of population with at least college, under 1 year education in the United States with a correlation coefficient (R) of -0.144 and weighted average of 68.2%. Similarly, the statistical analysis conducted on geographies consisting of 475,810,175 people shows a substantial positive correlation between the proportion of Thais and percentage of population with at least college, under 1 year education in the United States with a correlation coefficient (R) of 0.527 and weighted average of 73.4%, a difference of 7.6%.
College, Under 1 year Correlation Summary
| Measurement | Luxembourger | Thai |
| Minimum | 16.7% | 56.5% |
| Maximum | 88.7% | 100.0% |
| Range | 72.1% | 43.5% |
| Mean | 59.8% | 80.3% |
| Median | 60.6% | 79.9% |
| Interquartile 25% (IQ1) | 55.4% | 75.8% |
| Interquartile 75% (IQ3) | 66.5% | 85.5% |
| Interquartile Range (IQR) | 11.1% | 9.6% |
| Standard Deviation (Sample) | 13.2% | 8.2% |
| Standard Deviation (Population) | 13.1% | 8.2% |
Similar Demographics by College, Under 1 year
Demographics Similar to Luxembourgers by College, Under 1 year
In terms of college, under 1 year, the demographic groups most similar to Luxembourgers are European (68.2%, a difference of 0.010%), Icelander (68.3%, a difference of 0.040%), Romanian (68.2%, a difference of 0.090%), Ethiopian (68.3%, a difference of 0.10%), and Croatian (68.3%, a difference of 0.11%).
| Demographics | Rating | Rank | College, Under 1 year |
| Egyptians | 98.3 /100 | #85 | Exceptional 68.3% |
| Immigrants | Lebanon | 98.3 /100 | #86 | Exceptional 68.3% |
| Chinese | 98.3 /100 | #87 | Exceptional 68.3% |
| Croatians | 98.2 /100 | #88 | Exceptional 68.3% |
| Ethiopians | 98.2 /100 | #89 | Exceptional 68.3% |
| Icelanders | 98.1 /100 | #90 | Exceptional 68.3% |
| Europeans | 98.1 /100 | #91 | Exceptional 68.2% |
| Luxembourgers | 98.1 /100 | #92 | Exceptional 68.2% |
| Romanians | 97.9 /100 | #93 | Exceptional 68.2% |
| Armenians | 97.7 /100 | #94 | Exceptional 68.1% |
| Immigrants | Pakistan | 97.5 /100 | #95 | Exceptional 68.0% |
| Jordanians | 97.4 /100 | #96 | Exceptional 68.0% |
| Immigrants | Ethiopia | 97.3 /100 | #97 | Exceptional 68.0% |
| Paraguayans | 97.1 /100 | #98 | Exceptional 67.9% |
| Immigrants | Bolivia | 97.0 /100 | #99 | Exceptional 67.9% |
Demographics Similar to Thais by College, Under 1 year
In terms of college, under 1 year, the demographic groups most similar to Thais are Okinawan (73.7%, a difference of 0.33%), Immigrants from Australia (72.7%, a difference of 0.95%), Immigrants from Taiwan (74.2%, a difference of 1.0%), Immigrants from Iran (74.3%, a difference of 1.1%), and Immigrants from India (74.4%, a difference of 1.4%).
| Demographics | Rating | Rank | College, Under 1 year |
| Filipinos | 100.0 /100 | #1 | Exceptional 75.5% |
| Iranians | 100.0 /100 | #2 | Exceptional 74.9% |
| Immigrants | Singapore | 100.0 /100 | #3 | Exceptional 74.8% |
| Immigrants | India | 100.0 /100 | #4 | Exceptional 74.4% |
| Immigrants | Iran | 100.0 /100 | #5 | Exceptional 74.3% |
| Immigrants | Taiwan | 100.0 /100 | #6 | Exceptional 74.2% |
| Okinawans | 100.0 /100 | #7 | Exceptional 73.7% |
| Thais | 100.0 /100 | #8 | Exceptional 73.4% |
| Immigrants | Australia | 100.0 /100 | #9 | Exceptional 72.7% |
| Immigrants | Israel | 100.0 /100 | #10 | Exceptional 72.3% |
| Immigrants | South Central Asia | 100.0 /100 | #11 | Exceptional 72.1% |
| Immigrants | Sweden | 100.0 /100 | #12 | Exceptional 72.1% |
| Cypriots | 100.0 /100 | #13 | Exceptional 72.0% |
| Cambodians | 100.0 /100 | #14 | Exceptional 71.9% |
| Burmese | 100.0 /100 | #15 | Exceptional 71.9% |