Luxembourger vs Indian (Asian) College, Under 1 year
COMPARE
Luxembourger
Indian (Asian)
College, Under 1 year
College, Under 1 year Comparison
Luxembourgers
Indians (Asian)
68.2%
COLLEGE, UNDER 1 YEAR
98.1/ 100
METRIC RATING
92nd/ 347
METRIC RANK
70.8%
COLLEGE, UNDER 1 YEAR
99.9/ 100
METRIC RATING
31st/ 347
METRIC RANK
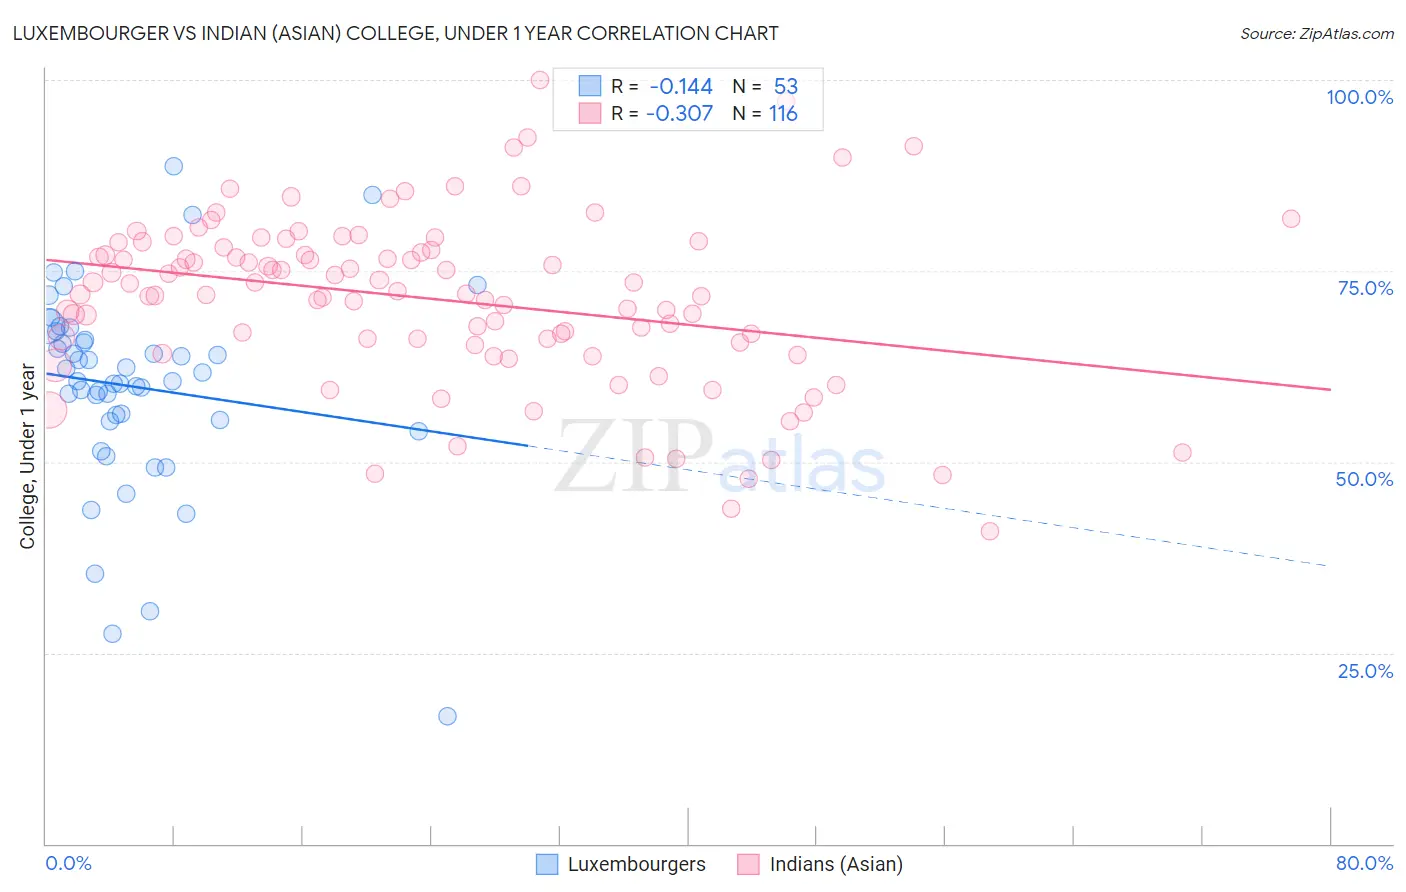
Luxembourger vs Indian (Asian) College, Under 1 year Correlation Chart
The statistical analysis conducted on geographies consisting of 144,676,190 people shows a poor negative correlation between the proportion of Luxembourgers and percentage of population with at least college, under 1 year education in the United States with a correlation coefficient (R) of -0.144 and weighted average of 68.2%. Similarly, the statistical analysis conducted on geographies consisting of 495,343,184 people shows a mild negative correlation between the proportion of Indians (Asian) and percentage of population with at least college, under 1 year education in the United States with a correlation coefficient (R) of -0.307 and weighted average of 70.8%, a difference of 3.7%.
College, Under 1 year Correlation Summary
| Measurement | Luxembourger | Indian (Asian) |
| Minimum | 16.7% | 40.9% |
| Maximum | 88.7% | 100.0% |
| Range | 72.1% | 59.1% |
| Mean | 59.8% | 71.3% |
| Median | 60.6% | 72.2% |
| Interquartile 25% (IQ1) | 55.4% | 65.9% |
| Interquartile 75% (IQ3) | 66.5% | 77.9% |
| Interquartile Range (IQR) | 11.1% | 12.0% |
| Standard Deviation (Sample) | 13.2% | 11.1% |
| Standard Deviation (Population) | 13.1% | 11.0% |
Similar Demographics by College, Under 1 year
Demographics Similar to Luxembourgers by College, Under 1 year
In terms of college, under 1 year, the demographic groups most similar to Luxembourgers are European (68.2%, a difference of 0.010%), Icelander (68.3%, a difference of 0.040%), Romanian (68.2%, a difference of 0.090%), Ethiopian (68.3%, a difference of 0.10%), and Croatian (68.3%, a difference of 0.11%).
| Demographics | Rating | Rank | College, Under 1 year |
| Egyptians | 98.3 /100 | #85 | Exceptional 68.3% |
| Immigrants | Lebanon | 98.3 /100 | #86 | Exceptional 68.3% |
| Chinese | 98.3 /100 | #87 | Exceptional 68.3% |
| Croatians | 98.2 /100 | #88 | Exceptional 68.3% |
| Ethiopians | 98.2 /100 | #89 | Exceptional 68.3% |
| Icelanders | 98.1 /100 | #90 | Exceptional 68.3% |
| Europeans | 98.1 /100 | #91 | Exceptional 68.2% |
| Luxembourgers | 98.1 /100 | #92 | Exceptional 68.2% |
| Romanians | 97.9 /100 | #93 | Exceptional 68.2% |
| Armenians | 97.7 /100 | #94 | Exceptional 68.1% |
| Immigrants | Pakistan | 97.5 /100 | #95 | Exceptional 68.0% |
| Jordanians | 97.4 /100 | #96 | Exceptional 68.0% |
| Immigrants | Ethiopia | 97.3 /100 | #97 | Exceptional 68.0% |
| Paraguayans | 97.1 /100 | #98 | Exceptional 67.9% |
| Immigrants | Bolivia | 97.0 /100 | #99 | Exceptional 67.9% |
Demographics Similar to Indians (Asian) by College, Under 1 year
In terms of college, under 1 year, the demographic groups most similar to Indians (Asian) are Turkish (70.7%, a difference of 0.080%), Immigrants from China (70.9%, a difference of 0.11%), Immigrants from South Africa (70.6%, a difference of 0.25%), Estonian (70.6%, a difference of 0.27%), and Immigrants from Hong Kong (71.0%, a difference of 0.29%).
| Demographics | Rating | Rank | College, Under 1 year |
| Soviet Union | 100.0 /100 | #24 | Exceptional 71.1% |
| Bulgarians | 100.0 /100 | #25 | Exceptional 71.1% |
| Immigrants | Denmark | 100.0 /100 | #26 | Exceptional 71.0% |
| Immigrants | Ireland | 100.0 /100 | #27 | Exceptional 71.0% |
| Immigrants | Hong Kong | 100.0 /100 | #28 | Exceptional 71.0% |
| Immigrants | France | 100.0 /100 | #29 | Exceptional 71.0% |
| Immigrants | China | 99.9 /100 | #30 | Exceptional 70.9% |
| Indians (Asian) | 99.9 /100 | #31 | Exceptional 70.8% |
| Turks | 99.9 /100 | #32 | Exceptional 70.7% |
| Immigrants | South Africa | 99.9 /100 | #33 | Exceptional 70.6% |
| Estonians | 99.9 /100 | #34 | Exceptional 70.6% |
| Russians | 99.9 /100 | #35 | Exceptional 70.5% |
| Immigrants | Sri Lanka | 99.9 /100 | #36 | Exceptional 70.5% |
| Immigrants | Saudi Arabia | 99.9 /100 | #37 | Exceptional 70.4% |
| Australians | 99.9 /100 | #38 | Exceptional 70.4% |