Luxembourger vs Immigrants from Congo Per Capita Income
COMPARE
Luxembourger
Immigrants from Congo
Per Capita Income
Per Capita Income Comparison
Luxembourgers
Immigrants from Congo
$45,663
PER CAPITA INCOME
90.4/ 100
METRIC RATING
129th/ 347
METRIC RANK
$35,720
PER CAPITA INCOME
0.0/ 100
METRIC RATING
319th/ 347
METRIC RANK
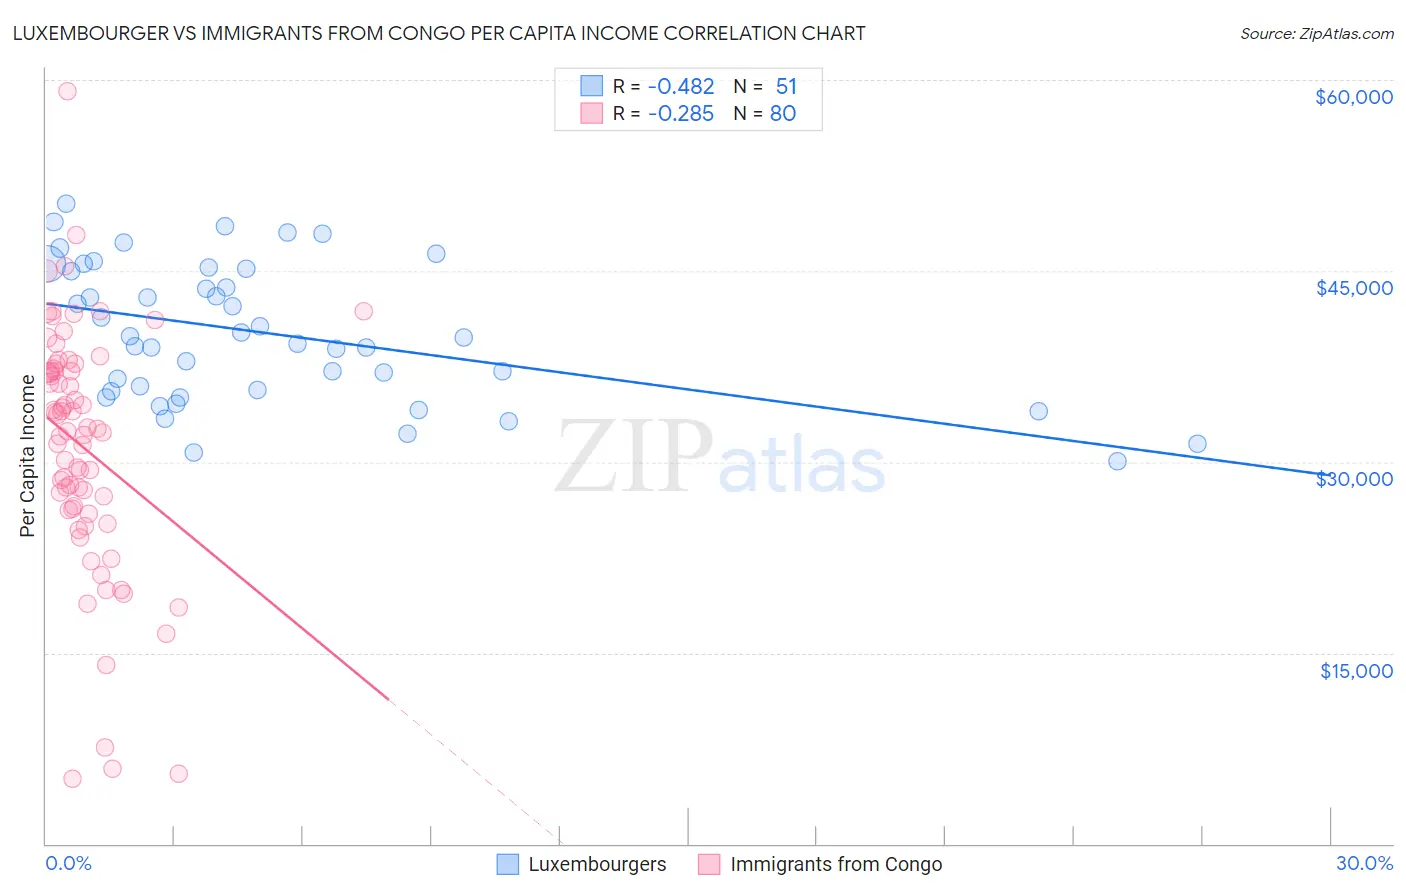
Luxembourger vs Immigrants from Congo Per Capita Income Correlation Chart
The statistical analysis conducted on geographies consisting of 144,682,505 people shows a moderate negative correlation between the proportion of Luxembourgers and per capita income in the United States with a correlation coefficient (R) of -0.482 and weighted average of $45,663. Similarly, the statistical analysis conducted on geographies consisting of 92,126,617 people shows a weak negative correlation between the proportion of Immigrants from Congo and per capita income in the United States with a correlation coefficient (R) of -0.285 and weighted average of $35,720, a difference of 27.8%.
Per Capita Income Correlation Summary
| Measurement | Luxembourger | Immigrants from Congo |
| Minimum | $30,080 | $5,075 |
| Maximum | $50,248 | $59,125 |
| Range | $20,168 | $54,050 |
| Mean | $40,097 | $31,172 |
| Median | $39,752 | $32,475 |
| Interquartile 25% (IQ1) | $35,555 | $26,293 |
| Interquartile 75% (IQ3) | $45,199 | $37,243 |
| Interquartile Range (IQR) | $9,644 | $10,950 |
| Standard Deviation (Sample) | $5,390 | $9,699 |
| Standard Deviation (Population) | $5,337 | $9,639 |
Similar Demographics by Per Capita Income
Demographics Similar to Luxembourgers by Per Capita Income
In terms of per capita income, the demographic groups most similar to Luxembourgers are Arab ($45,662, a difference of 0.0%), Immigrants from North Macedonia ($45,622, a difference of 0.090%), Jordanian ($45,605, a difference of 0.13%), Pakistani ($45,587, a difference of 0.17%), and Slovene ($45,581, a difference of 0.18%).
| Demographics | Rating | Rank | Per Capita Income |
| Moroccans | 92.1 /100 | #122 | Exceptional $45,854 |
| Lebanese | 92.0 /100 | #123 | Exceptional $45,840 |
| Europeans | 92.0 /100 | #124 | Exceptional $45,836 |
| Zimbabweans | 91.7 /100 | #125 | Exceptional $45,804 |
| Palestinians | 91.6 /100 | #126 | Exceptional $45,790 |
| Immigrants | Germany | 91.3 /100 | #127 | Exceptional $45,751 |
| Swedes | 91.3 /100 | #128 | Exceptional $45,750 |
| Luxembourgers | 90.4 /100 | #129 | Exceptional $45,663 |
| Arabs | 90.4 /100 | #130 | Exceptional $45,662 |
| Immigrants | North Macedonia | 90.0 /100 | #131 | Exceptional $45,622 |
| Jordanians | 89.9 /100 | #132 | Excellent $45,605 |
| Pakistanis | 89.7 /100 | #133 | Excellent $45,587 |
| Slovenes | 89.6 /100 | #134 | Excellent $45,581 |
| Hungarians | 87.9 /100 | #135 | Excellent $45,426 |
| Immigrants | Oceania | 85.2 /100 | #136 | Excellent $45,220 |
Demographics Similar to Immigrants from Congo by Per Capita Income
In terms of per capita income, the demographic groups most similar to Immigrants from Congo are Hispanic or Latino ($35,688, a difference of 0.090%), Black/African American ($35,564, a difference of 0.44%), Creek ($35,546, a difference of 0.49%), Bangladeshi ($35,897, a difference of 0.50%), and Dutch West Indian ($35,922, a difference of 0.57%).
| Demographics | Rating | Rank | Per Capita Income |
| Chickasaw | 0.0 /100 | #312 | Tragic $36,475 |
| Bahamians | 0.0 /100 | #313 | Tragic $36,427 |
| Seminole | 0.0 /100 | #314 | Tragic $36,180 |
| Yaqui | 0.0 /100 | #315 | Tragic $36,112 |
| Choctaw | 0.0 /100 | #316 | Tragic $35,999 |
| Dutch West Indians | 0.0 /100 | #317 | Tragic $35,922 |
| Bangladeshis | 0.0 /100 | #318 | Tragic $35,897 |
| Immigrants | Congo | 0.0 /100 | #319 | Tragic $35,720 |
| Hispanics or Latinos | 0.0 /100 | #320 | Tragic $35,688 |
| Blacks/African Americans | 0.0 /100 | #321 | Tragic $35,564 |
| Creek | 0.0 /100 | #322 | Tragic $35,546 |
| Cheyenne | 0.0 /100 | #323 | Tragic $35,276 |
| Kiowa | 0.0 /100 | #324 | Tragic $35,102 |
| Immigrants | Central America | 0.0 /100 | #325 | Tragic $34,974 |
| Immigrants | Cuba | 0.0 /100 | #326 | Tragic $34,910 |