Immigrants from Portugal vs Bolivian College, Under 1 year
COMPARE
Immigrants from Portugal
Bolivian
College, Under 1 year
College, Under 1 year Comparison
Immigrants from Portugal
Bolivians
57.7%
COLLEGE, UNDER 1 YEAR
0.0/ 100
METRIC RATING
306th/ 347
METRIC RANK
68.7%
COLLEGE, UNDER 1 YEAR
99.0/ 100
METRIC RATING
72nd/ 347
METRIC RANK
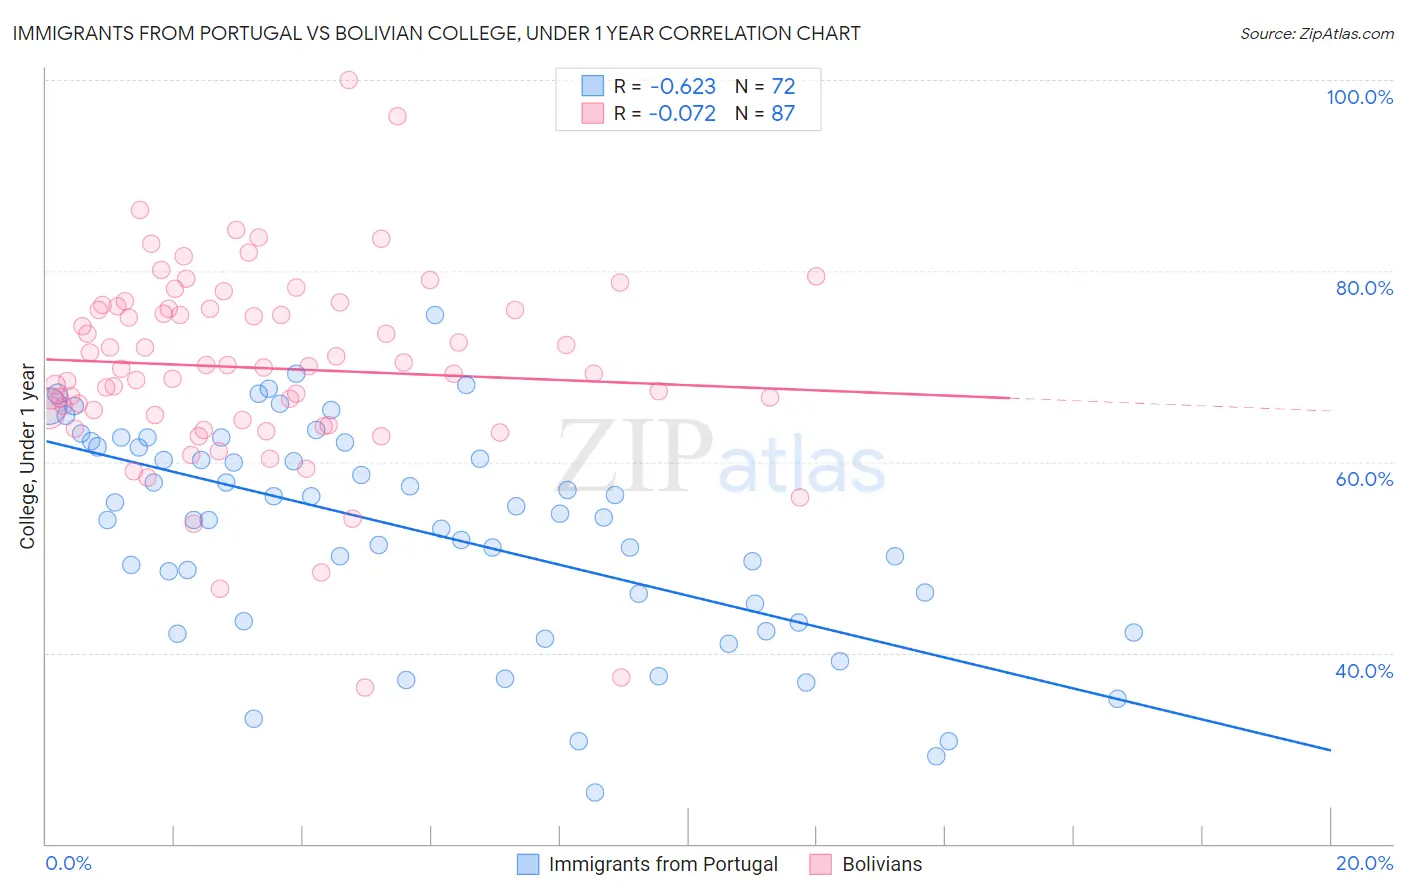
Immigrants from Portugal vs Bolivian College, Under 1 year Correlation Chart
The statistical analysis conducted on geographies consisting of 174,792,047 people shows a significant negative correlation between the proportion of Immigrants from Portugal and percentage of population with at least college, under 1 year education in the United States with a correlation coefficient (R) of -0.623 and weighted average of 57.7%. Similarly, the statistical analysis conducted on geographies consisting of 184,667,998 people shows a slight negative correlation between the proportion of Bolivians and percentage of population with at least college, under 1 year education in the United States with a correlation coefficient (R) of -0.072 and weighted average of 68.7%, a difference of 19.2%.
College, Under 1 year Correlation Summary
| Measurement | Immigrants from Portugal | Bolivian |
| Minimum | 25.4% | 36.3% |
| Maximum | 75.4% | 100.0% |
| Range | 50.1% | 63.7% |
| Mean | 52.8% | 69.8% |
| Median | 54.4% | 69.8% |
| Interquartile 25% (IQ1) | 44.2% | 64.4% |
| Interquartile 75% (IQ3) | 61.8% | 76.1% |
| Interquartile Range (IQR) | 17.6% | 11.7% |
| Standard Deviation (Sample) | 11.2% | 10.3% |
| Standard Deviation (Population) | 11.1% | 10.3% |
Similar Demographics by College, Under 1 year
Demographics Similar to Immigrants from Portugal by College, Under 1 year
In terms of college, under 1 year, the demographic groups most similar to Immigrants from Portugal are Fijian (57.7%, a difference of 0.010%), Central American (57.7%, a difference of 0.010%), Immigrants from Nicaragua (57.6%, a difference of 0.14%), Haitian (57.8%, a difference of 0.20%), and Kiowa (57.8%, a difference of 0.31%).
| Demographics | Rating | Rank | College, Under 1 year |
| Cubans | 0.0 /100 | #299 | Tragic 58.6% |
| Immigrants | Guyana | 0.0 /100 | #300 | Tragic 58.5% |
| Mexican American Indians | 0.0 /100 | #301 | Tragic 58.1% |
| Apache | 0.0 /100 | #302 | Tragic 58.0% |
| Immigrants | Dominica | 0.0 /100 | #303 | Tragic 57.9% |
| Kiowa | 0.0 /100 | #304 | Tragic 57.8% |
| Haitians | 0.0 /100 | #305 | Tragic 57.8% |
| Immigrants | Portugal | 0.0 /100 | #306 | Tragic 57.7% |
| Fijians | 0.0 /100 | #307 | Tragic 57.7% |
| Central Americans | 0.0 /100 | #308 | Tragic 57.7% |
| Immigrants | Nicaragua | 0.0 /100 | #309 | Tragic 57.6% |
| Pueblo | 0.0 /100 | #310 | Tragic 57.4% |
| Cajuns | 0.0 /100 | #311 | Tragic 57.3% |
| Salvadorans | 0.0 /100 | #312 | Tragic 57.3% |
| Dutch West Indians | 0.0 /100 | #313 | Tragic 57.2% |
Demographics Similar to Bolivians by College, Under 1 year
In terms of college, under 1 year, the demographic groups most similar to Bolivians are Immigrants from Europe (68.8%, a difference of 0.040%), Immigrants from England (68.7%, a difference of 0.040%), Lithuanian (68.8%, a difference of 0.060%), Swedish (68.7%, a difference of 0.090%), and Immigrants from Romania (68.9%, a difference of 0.22%).
| Demographics | Rating | Rank | College, Under 1 year |
| Immigrants | Moldova | 99.3 /100 | #65 | Exceptional 69.0% |
| Immigrants | North America | 99.3 /100 | #66 | Exceptional 69.0% |
| Immigrants | Zimbabwe | 99.2 /100 | #67 | Exceptional 68.9% |
| Immigrants | Indonesia | 99.2 /100 | #68 | Exceptional 68.9% |
| Immigrants | Romania | 99.2 /100 | #69 | Exceptional 68.9% |
| Lithuanians | 99.1 /100 | #70 | Exceptional 68.8% |
| Immigrants | Europe | 99.1 /100 | #71 | Exceptional 68.8% |
| Bolivians | 99.0 /100 | #72 | Exceptional 68.7% |
| Immigrants | England | 99.0 /100 | #73 | Exceptional 68.7% |
| Swedes | 98.9 /100 | #74 | Exceptional 68.7% |
| Immigrants | Western Europe | 98.6 /100 | #75 | Exceptional 68.5% |
| Laotians | 98.6 /100 | #76 | Exceptional 68.5% |
| British | 98.6 /100 | #77 | Exceptional 68.5% |
| Danes | 98.6 /100 | #78 | Exceptional 68.5% |
| Greeks | 98.6 /100 | #79 | Exceptional 68.5% |