Lumbee vs Immigrants from Guyana 6th Grade
COMPARE
Lumbee
Immigrants from Guyana
6th Grade
6th Grade Comparison
Lumbee
Immigrants from Guyana
97.6%
6TH GRADE
99.2/ 100
METRIC RATING
81st/ 347
METRIC RANK
95.5%
6TH GRADE
0.0/ 100
METRIC RATING
312th/ 347
METRIC RANK
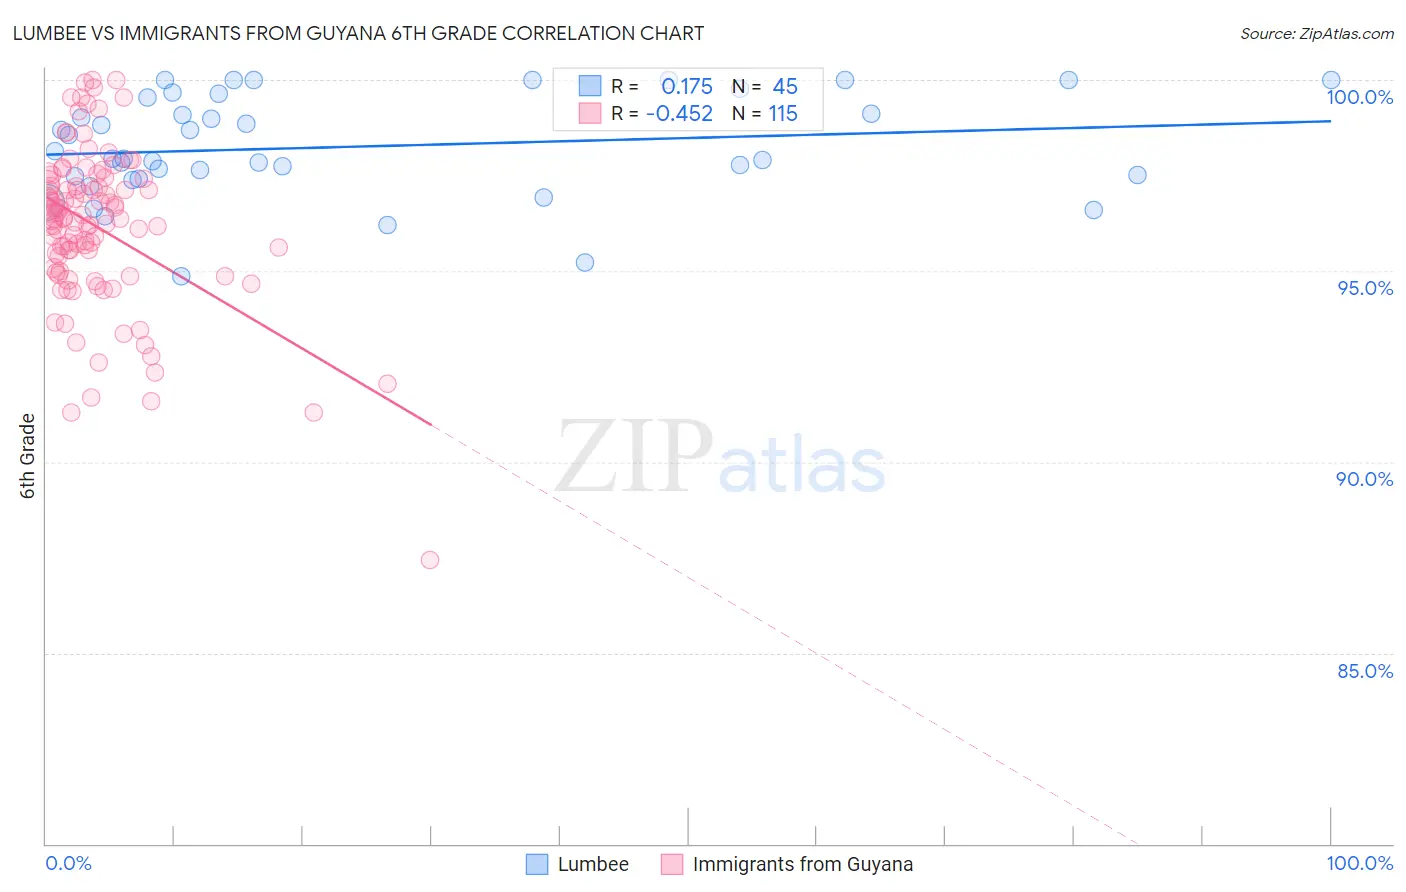
Lumbee vs Immigrants from Guyana 6th Grade Correlation Chart
The statistical analysis conducted on geographies consisting of 92,298,549 people shows a poor positive correlation between the proportion of Lumbee and percentage of population with at least 6th grade education in the United States with a correlation coefficient (R) of 0.175 and weighted average of 97.6%. Similarly, the statistical analysis conducted on geographies consisting of 183,673,461 people shows a moderate negative correlation between the proportion of Immigrants from Guyana and percentage of population with at least 6th grade education in the United States with a correlation coefficient (R) of -0.452 and weighted average of 95.5%, a difference of 2.2%.
6th Grade Correlation Summary
| Measurement | Lumbee | Immigrants from Guyana |
| Minimum | 94.9% | 87.4% |
| Maximum | 100.0% | 100.0% |
| Range | 5.1% | 12.6% |
| Mean | 98.3% | 96.2% |
| Median | 97.9% | 96.4% |
| Interquartile 25% (IQ1) | 97.5% | 95.0% |
| Interquartile 75% (IQ3) | 99.6% | 97.3% |
| Interquartile Range (IQR) | 2.1% | 2.3% |
| Standard Deviation (Sample) | 1.3% | 2.1% |
| Standard Deviation (Population) | 1.3% | 2.1% |
Similar Demographics by 6th Grade
Demographics Similar to Lumbee by 6th Grade
In terms of 6th grade, the demographic groups most similar to Lumbee are Zimbabwean (97.6%, a difference of 0.0%), Osage (97.6%, a difference of 0.010%), Potawatomi (97.6%, a difference of 0.010%), Immigrants from Lithuania (97.6%, a difference of 0.020%), and Icelander (97.6%, a difference of 0.020%).
| Demographics | Rating | Rank | 6th Grade |
| Immigrants | Netherlands | 99.4 /100 | #74 | Exceptional 97.6% |
| Ukrainians | 99.4 /100 | #75 | Exceptional 97.6% |
| Immigrants | England | 99.4 /100 | #76 | Exceptional 97.6% |
| Immigrants | Lithuania | 99.3 /100 | #77 | Exceptional 97.6% |
| Icelanders | 99.3 /100 | #78 | Exceptional 97.6% |
| Immigrants | India | 99.3 /100 | #79 | Exceptional 97.6% |
| Osage | 99.3 /100 | #80 | Exceptional 97.6% |
| Lumbee | 99.2 /100 | #81 | Exceptional 97.6% |
| Zimbabweans | 99.1 /100 | #82 | Exceptional 97.6% |
| Potawatomi | 99.1 /100 | #83 | Exceptional 97.6% |
| Shoshone | 99.0 /100 | #84 | Exceptional 97.6% |
| Delaware | 98.9 /100 | #85 | Exceptional 97.6% |
| Immigrants | Belgium | 98.9 /100 | #86 | Exceptional 97.5% |
| Puget Sound Salish | 98.9 /100 | #87 | Exceptional 97.5% |
| Immigrants | South Africa | 98.9 /100 | #88 | Exceptional 97.5% |
Demographics Similar to Immigrants from Guyana by 6th Grade
In terms of 6th grade, the demographic groups most similar to Immigrants from Guyana are Immigrants from Portugal (95.5%, a difference of 0.010%), Ecuadorian (95.5%, a difference of 0.030%), Puerto Rican (95.5%, a difference of 0.040%), Immigrants from Caribbean (95.6%, a difference of 0.090%), and Nicaraguan (95.4%, a difference of 0.090%).
| Demographics | Rating | Rank | 6th Grade |
| Immigrants | Cuba | 0.0 /100 | #305 | Tragic 95.6% |
| Immigrants | Haiti | 0.0 /100 | #306 | Tragic 95.6% |
| Guyanese | 0.0 /100 | #307 | Tragic 95.6% |
| Immigrants | Caribbean | 0.0 /100 | #308 | Tragic 95.6% |
| Puerto Ricans | 0.0 /100 | #309 | Tragic 95.5% |
| Ecuadorians | 0.0 /100 | #310 | Tragic 95.5% |
| Immigrants | Portugal | 0.0 /100 | #311 | Tragic 95.5% |
| Immigrants | Guyana | 0.0 /100 | #312 | Tragic 95.5% |
| Nicaraguans | 0.0 /100 | #313 | Tragic 95.4% |
| Immigrants | Vietnam | 0.0 /100 | #314 | Tragic 95.4% |
| Immigrants | Bangladesh | 0.0 /100 | #315 | Tragic 95.4% |
| Japanese | 0.0 /100 | #316 | Tragic 95.4% |
| Vietnamese | 0.0 /100 | #317 | Tragic 95.3% |
| Belizeans | 0.0 /100 | #318 | Tragic 95.3% |
| Immigrants | Belize | 0.0 /100 | #319 | Tragic 95.3% |