Lumbee vs Bhutanese 6th Grade
COMPARE
Lumbee
Bhutanese
6th Grade
6th Grade Comparison
Lumbee
Bhutanese
97.6%
6TH GRADE
99.2/ 100
METRIC RATING
81st/ 347
METRIC RANK
97.5%
6TH GRADE
98.0/ 100
METRIC RATING
103rd/ 347
METRIC RANK
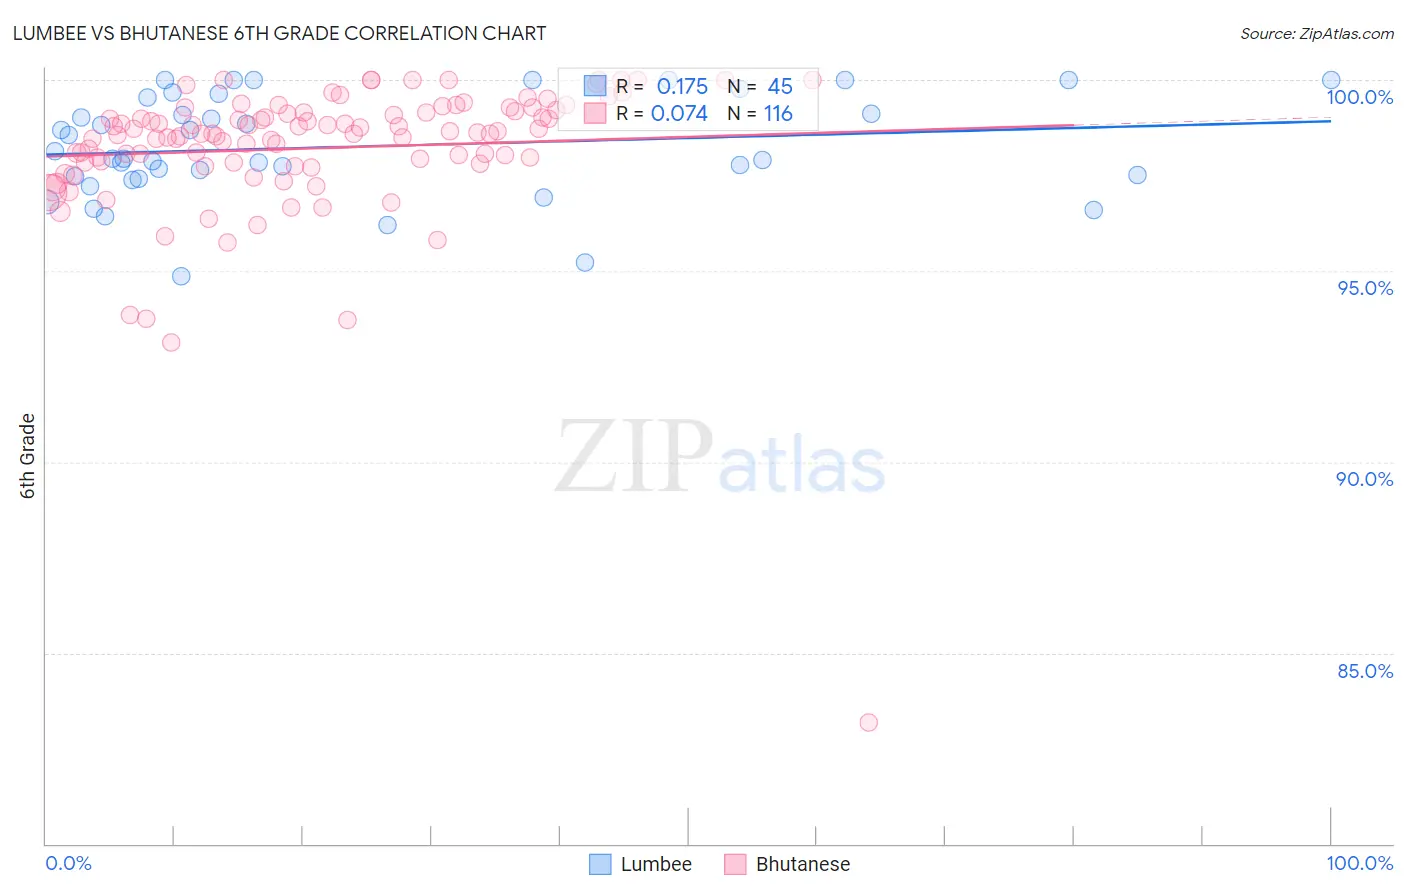
Lumbee vs Bhutanese 6th Grade Correlation Chart
The statistical analysis conducted on geographies consisting of 92,298,549 people shows a poor positive correlation between the proportion of Lumbee and percentage of population with at least 6th grade education in the United States with a correlation coefficient (R) of 0.175 and weighted average of 97.6%. Similarly, the statistical analysis conducted on geographies consisting of 455,591,134 people shows a slight positive correlation between the proportion of Bhutanese and percentage of population with at least 6th grade education in the United States with a correlation coefficient (R) of 0.074 and weighted average of 97.5%, a difference of 0.10%.
6th Grade Correlation Summary
| Measurement | Lumbee | Bhutanese |
| Minimum | 94.9% | 83.2% |
| Maximum | 100.0% | 100.0% |
| Range | 5.1% | 16.8% |
| Mean | 98.3% | 98.2% |
| Median | 97.9% | 98.6% |
| Interquartile 25% (IQ1) | 97.5% | 97.8% |
| Interquartile 75% (IQ3) | 99.6% | 99.2% |
| Interquartile Range (IQR) | 2.1% | 1.3% |
| Standard Deviation (Sample) | 1.3% | 1.9% |
| Standard Deviation (Population) | 1.3% | 1.9% |
Similar Demographics by 6th Grade
Demographics Similar to Lumbee by 6th Grade
In terms of 6th grade, the demographic groups most similar to Lumbee are Zimbabwean (97.6%, a difference of 0.0%), Osage (97.6%, a difference of 0.010%), Potawatomi (97.6%, a difference of 0.010%), Immigrants from Lithuania (97.6%, a difference of 0.020%), and Icelander (97.6%, a difference of 0.020%).
| Demographics | Rating | Rank | 6th Grade |
| Immigrants | Netherlands | 99.4 /100 | #74 | Exceptional 97.6% |
| Ukrainians | 99.4 /100 | #75 | Exceptional 97.6% |
| Immigrants | England | 99.4 /100 | #76 | Exceptional 97.6% |
| Immigrants | Lithuania | 99.3 /100 | #77 | Exceptional 97.6% |
| Icelanders | 99.3 /100 | #78 | Exceptional 97.6% |
| Immigrants | India | 99.3 /100 | #79 | Exceptional 97.6% |
| Osage | 99.3 /100 | #80 | Exceptional 97.6% |
| Lumbee | 99.2 /100 | #81 | Exceptional 97.6% |
| Zimbabweans | 99.1 /100 | #82 | Exceptional 97.6% |
| Potawatomi | 99.1 /100 | #83 | Exceptional 97.6% |
| Shoshone | 99.0 /100 | #84 | Exceptional 97.6% |
| Delaware | 98.9 /100 | #85 | Exceptional 97.6% |
| Immigrants | Belgium | 98.9 /100 | #86 | Exceptional 97.5% |
| Puget Sound Salish | 98.9 /100 | #87 | Exceptional 97.5% |
| Immigrants | South Africa | 98.9 /100 | #88 | Exceptional 97.5% |
Demographics Similar to Bhutanese by 6th Grade
In terms of 6th grade, the demographic groups most similar to Bhutanese are Choctaw (97.5%, a difference of 0.0%), German Russian (97.5%, a difference of 0.0%), Cheyenne (97.5%, a difference of 0.0%), Menominee (97.5%, a difference of 0.010%), and Turkish (97.5%, a difference of 0.020%).
| Demographics | Rating | Rank | 6th Grade |
| Immigrants | Germany | 98.6 /100 | #96 | Exceptional 97.5% |
| Immigrants | Sweden | 98.6 /100 | #97 | Exceptional 97.5% |
| Immigrants | Denmark | 98.5 /100 | #98 | Exceptional 97.5% |
| Yugoslavians | 98.5 /100 | #99 | Exceptional 97.5% |
| Turks | 98.3 /100 | #100 | Exceptional 97.5% |
| South Africans | 98.2 /100 | #101 | Exceptional 97.5% |
| Choctaw | 98.0 /100 | #102 | Exceptional 97.5% |
| Bhutanese | 98.0 /100 | #103 | Exceptional 97.5% |
| German Russians | 97.9 /100 | #104 | Exceptional 97.5% |
| Cheyenne | 97.9 /100 | #105 | Exceptional 97.5% |
| Menominee | 97.7 /100 | #106 | Exceptional 97.5% |
| Immigrants | Singapore | 97.6 /100 | #107 | Exceptional 97.5% |
| Immigrants | Nonimmigrants | 97.3 /100 | #108 | Exceptional 97.4% |
| Immigrants | Czechoslovakia | 97.3 /100 | #109 | Exceptional 97.4% |
| Thais | 96.9 /100 | #110 | Exceptional 97.4% |