Immigrants from Pakistan vs Subsaharan African College, 1 year or more
COMPARE
Immigrants from Pakistan
Subsaharan African
College, 1 year or more
College, 1 year or more Comparison
Immigrants from Pakistan
Sub-Saharan Africans
62.8%
COLLEGE, 1 YEAR OR MORE
98.6/ 100
METRIC RATING
85th/ 347
METRIC RANK
57.3%
COLLEGE, 1 YEAR OR MORE
6.1/ 100
METRIC RATING
222nd/ 347
METRIC RANK
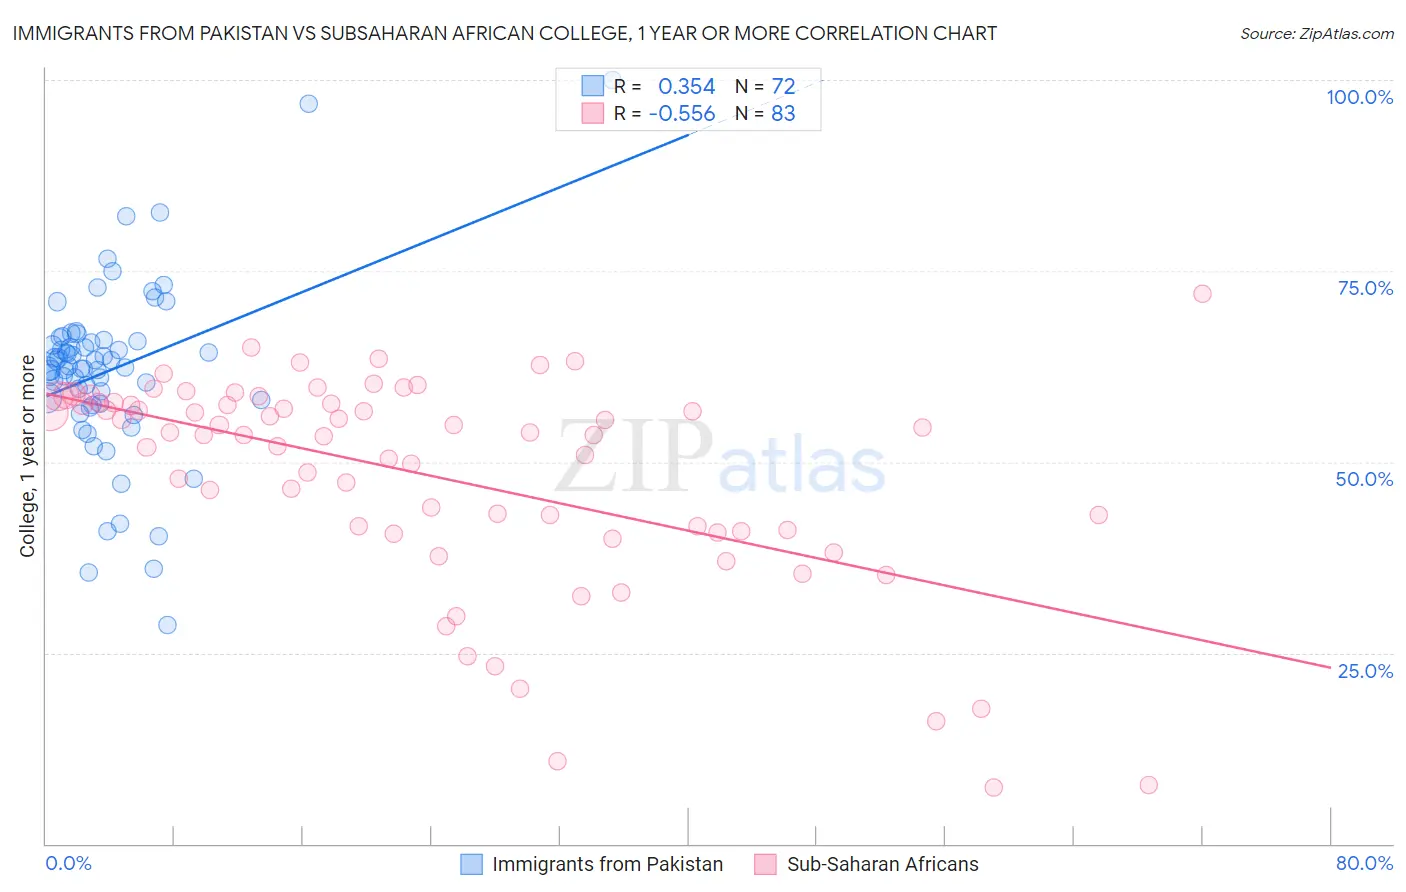
Immigrants from Pakistan vs Subsaharan African College, 1 year or more Correlation Chart
The statistical analysis conducted on geographies consisting of 283,910,237 people shows a mild positive correlation between the proportion of Immigrants from Pakistan and percentage of population with at least college, 1 year or more education in the United States with a correlation coefficient (R) of 0.354 and weighted average of 62.8%. Similarly, the statistical analysis conducted on geographies consisting of 508,212,148 people shows a substantial negative correlation between the proportion of Sub-Saharan Africans and percentage of population with at least college, 1 year or more education in the United States with a correlation coefficient (R) of -0.556 and weighted average of 57.3%, a difference of 9.6%.
College, 1 year or more Correlation Summary
| Measurement | Immigrants from Pakistan | Subsaharan African |
| Minimum | 28.6% | 7.4% |
| Maximum | 100.0% | 72.0% |
| Range | 71.4% | 64.6% |
| Mean | 62.0% | 48.2% |
| Median | 62.5% | 53.5% |
| Interquartile 25% (IQ1) | 57.9% | 40.9% |
| Interquartile 75% (IQ3) | 65.9% | 57.8% |
| Interquartile Range (IQR) | 8.1% | 16.8% |
| Standard Deviation (Sample) | 11.6% | 14.0% |
| Standard Deviation (Population) | 11.5% | 13.9% |
Similar Demographics by College, 1 year or more
Demographics Similar to Immigrants from Pakistan by College, 1 year or more
In terms of college, 1 year or more, the demographic groups most similar to Immigrants from Pakistan are Immigrants from England (62.8%, a difference of 0.010%), Immigrants from Western Europe (62.7%, a difference of 0.020%), Immigrants from Argentina (62.8%, a difference of 0.040%), Immigrants from Hungary (62.7%, a difference of 0.040%), and Immigrants from Bolivia (62.8%, a difference of 0.080%).
| Demographics | Rating | Rank | College, 1 year or more |
| Immigrants | Lebanon | 98.8 /100 | #78 | Exceptional 62.9% |
| Northern Europeans | 98.8 /100 | #79 | Exceptional 62.9% |
| Lithuanians | 98.8 /100 | #80 | Exceptional 62.9% |
| Laotians | 98.7 /100 | #81 | Exceptional 62.8% |
| Immigrants | Bolivia | 98.7 /100 | #82 | Exceptional 62.8% |
| Immigrants | Argentina | 98.6 /100 | #83 | Exceptional 62.8% |
| Immigrants | England | 98.6 /100 | #84 | Exceptional 62.8% |
| Immigrants | Pakistan | 98.6 /100 | #85 | Exceptional 62.8% |
| Immigrants | Western Europe | 98.6 /100 | #86 | Exceptional 62.7% |
| Immigrants | Hungary | 98.6 /100 | #87 | Exceptional 62.7% |
| Greeks | 98.3 /100 | #88 | Exceptional 62.6% |
| Immigrants | Ethiopia | 98.2 /100 | #89 | Exceptional 62.6% |
| Immigrants | Western Asia | 97.9 /100 | #90 | Exceptional 62.5% |
| Immigrants | Eastern Europe | 97.8 /100 | #91 | Exceptional 62.4% |
| Immigrants | Egypt | 97.8 /100 | #92 | Exceptional 62.4% |
Demographics Similar to Sub-Saharan Africans by College, 1 year or more
In terms of college, 1 year or more, the demographic groups most similar to Sub-Saharan Africans are Portuguese (57.2%, a difference of 0.17%), Hmong (57.2%, a difference of 0.17%), Immigrants from Ghana (57.4%, a difference of 0.34%), Vietnamese (57.0%, a difference of 0.38%), and Immigrants from Western Africa (57.0%, a difference of 0.40%).
| Demographics | Rating | Rank | College, 1 year or more |
| Tongans | 11.6 /100 | #215 | Poor 57.8% |
| Immigrants | Peru | 10.6 /100 | #216 | Poor 57.7% |
| Immigrants | Panama | 9.1 /100 | #217 | Tragic 57.6% |
| Native Hawaiians | 9.0 /100 | #218 | Tragic 57.6% |
| Whites/Caucasians | 8.7 /100 | #219 | Tragic 57.6% |
| Immigrants | Costa Rica | 8.0 /100 | #220 | Tragic 57.5% |
| Immigrants | Ghana | 7.7 /100 | #221 | Tragic 57.4% |
| Sub-Saharan Africans | 6.1 /100 | #222 | Tragic 57.3% |
| Portuguese | 5.4 /100 | #223 | Tragic 57.2% |
| Hmong | 5.4 /100 | #224 | Tragic 57.2% |
| Vietnamese | 4.7 /100 | #225 | Tragic 57.0% |
| Immigrants | Western Africa | 4.6 /100 | #226 | Tragic 57.0% |
| Immigrants | Immigrants | 4.4 /100 | #227 | Tragic 57.0% |
| Immigrants | Fiji | 4.0 /100 | #228 | Tragic 56.9% |
| Cree | 3.6 /100 | #229 | Tragic 56.8% |