Lumbee vs Argentinean College, 1 year or more
COMPARE
Lumbee
Argentinean
College, 1 year or more
College, 1 year or more Comparison
Lumbee
Argentineans
48.9%
COLLEGE, 1 YEAR OR MORE
0.0/ 100
METRIC RATING
334th/ 347
METRIC RANK
63.2%
COLLEGE, 1 YEAR OR MORE
99.2/ 100
METRIC RATING
70th/ 347
METRIC RANK
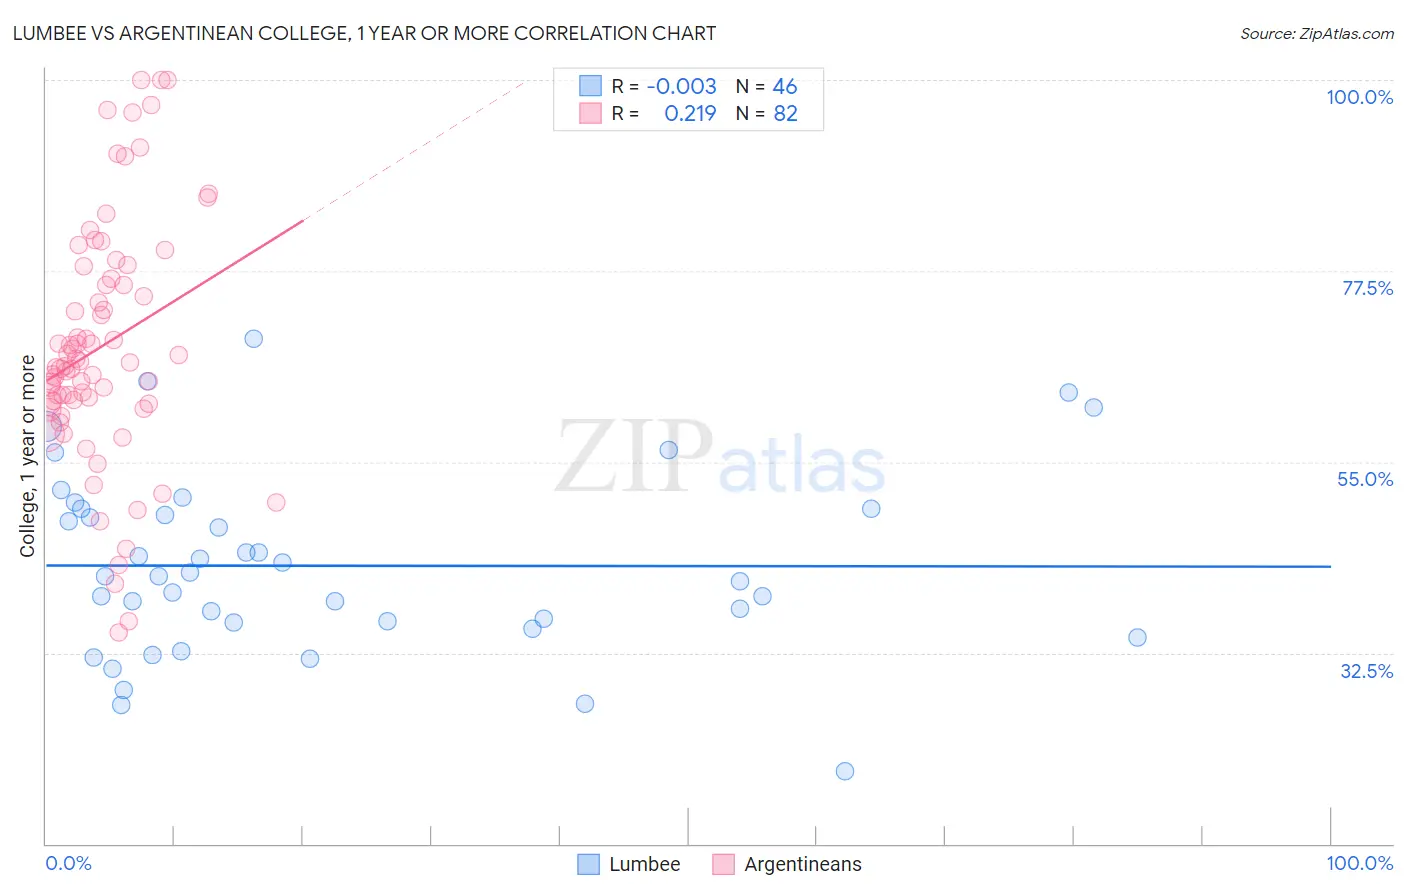
Lumbee vs Argentinean College, 1 year or more Correlation Chart
The statistical analysis conducted on geographies consisting of 92,299,068 people shows no correlation between the proportion of Lumbee and percentage of population with at least college, 1 year or more education in the United States with a correlation coefficient (R) of -0.003 and weighted average of 48.9%. Similarly, the statistical analysis conducted on geographies consisting of 297,139,739 people shows a weak positive correlation between the proportion of Argentineans and percentage of population with at least college, 1 year or more education in the United States with a correlation coefficient (R) of 0.219 and weighted average of 63.2%, a difference of 29.4%.
College, 1 year or more Correlation Summary
| Measurement | Lumbee | Argentinean |
| Minimum | 18.5% | 34.8% |
| Maximum | 69.5% | 100.0% |
| Range | 51.0% | 65.2% |
| Mean | 42.8% | 68.7% |
| Median | 41.5% | 66.5% |
| Interquartile 25% (IQ1) | 36.0% | 62.0% |
| Interquartile 75% (IQ3) | 49.4% | 76.5% |
| Interquartile Range (IQR) | 13.4% | 14.6% |
| Standard Deviation (Sample) | 10.9% | 14.2% |
| Standard Deviation (Population) | 10.8% | 14.2% |
Similar Demographics by College, 1 year or more
Demographics Similar to Lumbee by College, 1 year or more
In terms of college, 1 year or more, the demographic groups most similar to Lumbee are Yuman (48.7%, a difference of 0.28%), Immigrants from Dominican Republic (49.1%, a difference of 0.58%), Spanish American Indian (48.5%, a difference of 0.72%), Pennsylvania German (48.5%, a difference of 0.73%), and Mexican (49.2%, a difference of 0.75%).
| Demographics | Rating | Rank | College, 1 year or more |
| Menominee | 0.0 /100 | #327 | Tragic 50.6% |
| Dutch West Indians | 0.0 /100 | #328 | Tragic 50.5% |
| Cape Verdeans | 0.0 /100 | #329 | Tragic 50.3% |
| Natives/Alaskans | 0.0 /100 | #330 | Tragic 50.2% |
| Immigrants | Yemen | 0.0 /100 | #331 | Tragic 50.0% |
| Mexicans | 0.0 /100 | #332 | Tragic 49.2% |
| Immigrants | Dominican Republic | 0.0 /100 | #333 | Tragic 49.1% |
| Lumbee | 0.0 /100 | #334 | Tragic 48.9% |
| Yuman | 0.0 /100 | #335 | Tragic 48.7% |
| Spanish American Indians | 0.0 /100 | #336 | Tragic 48.5% |
| Pennsylvania Germans | 0.0 /100 | #337 | Tragic 48.5% |
| Immigrants | Central America | 0.0 /100 | #338 | Tragic 48.5% |
| Immigrants | Azores | 0.0 /100 | #339 | Tragic 48.4% |
| Immigrants | Cabo Verde | 0.0 /100 | #340 | Tragic 48.1% |
| Immigrants | Mexico | 0.0 /100 | #341 | Tragic 47.5% |
Demographics Similar to Argentineans by College, 1 year or more
In terms of college, 1 year or more, the demographic groups most similar to Argentineans are Immigrants from Greece (63.3%, a difference of 0.10%), Immigrants from Zimbabwe (63.3%, a difference of 0.10%), Immigrants from Romania (63.3%, a difference of 0.12%), Immigrants from Europe (63.3%, a difference of 0.13%), and Immigrants from Canada (63.1%, a difference of 0.18%).
| Demographics | Rating | Rank | College, 1 year or more |
| Immigrants | Scotland | 99.4 /100 | #63 | Exceptional 63.4% |
| Immigrants | Spain | 99.4 /100 | #64 | Exceptional 63.4% |
| Maltese | 99.3 /100 | #65 | Exceptional 63.4% |
| Immigrants | Europe | 99.3 /100 | #66 | Exceptional 63.3% |
| Immigrants | Romania | 99.3 /100 | #67 | Exceptional 63.3% |
| Immigrants | Greece | 99.3 /100 | #68 | Exceptional 63.3% |
| Immigrants | Zimbabwe | 99.3 /100 | #69 | Exceptional 63.3% |
| Argentineans | 99.2 /100 | #70 | Exceptional 63.2% |
| Immigrants | Canada | 99.1 /100 | #71 | Exceptional 63.1% |
| Egyptians | 99.0 /100 | #72 | Exceptional 63.1% |
| Immigrants | Moldova | 99.0 /100 | #73 | Exceptional 63.0% |
| Immigrants | North America | 99.0 /100 | #74 | Exceptional 63.0% |
| Armenians | 98.9 /100 | #75 | Exceptional 63.0% |
| Paraguayans | 98.8 /100 | #76 | Exceptional 62.9% |
| Ethiopians | 98.8 /100 | #77 | Exceptional 62.9% |