Moroccan vs Lebanese GED/Equivalency
COMPARE
Moroccan
Lebanese
GED/Equivalency
GED/Equivalency Comparison
Moroccans
Lebanese
85.5%
GED/EQUIVALENCY
37.7/ 100
METRIC RATING
181st/ 347
METRIC RANK
87.2%
GED/EQUIVALENCY
96.2/ 100
METRIC RATING
102nd/ 347
METRIC RANK
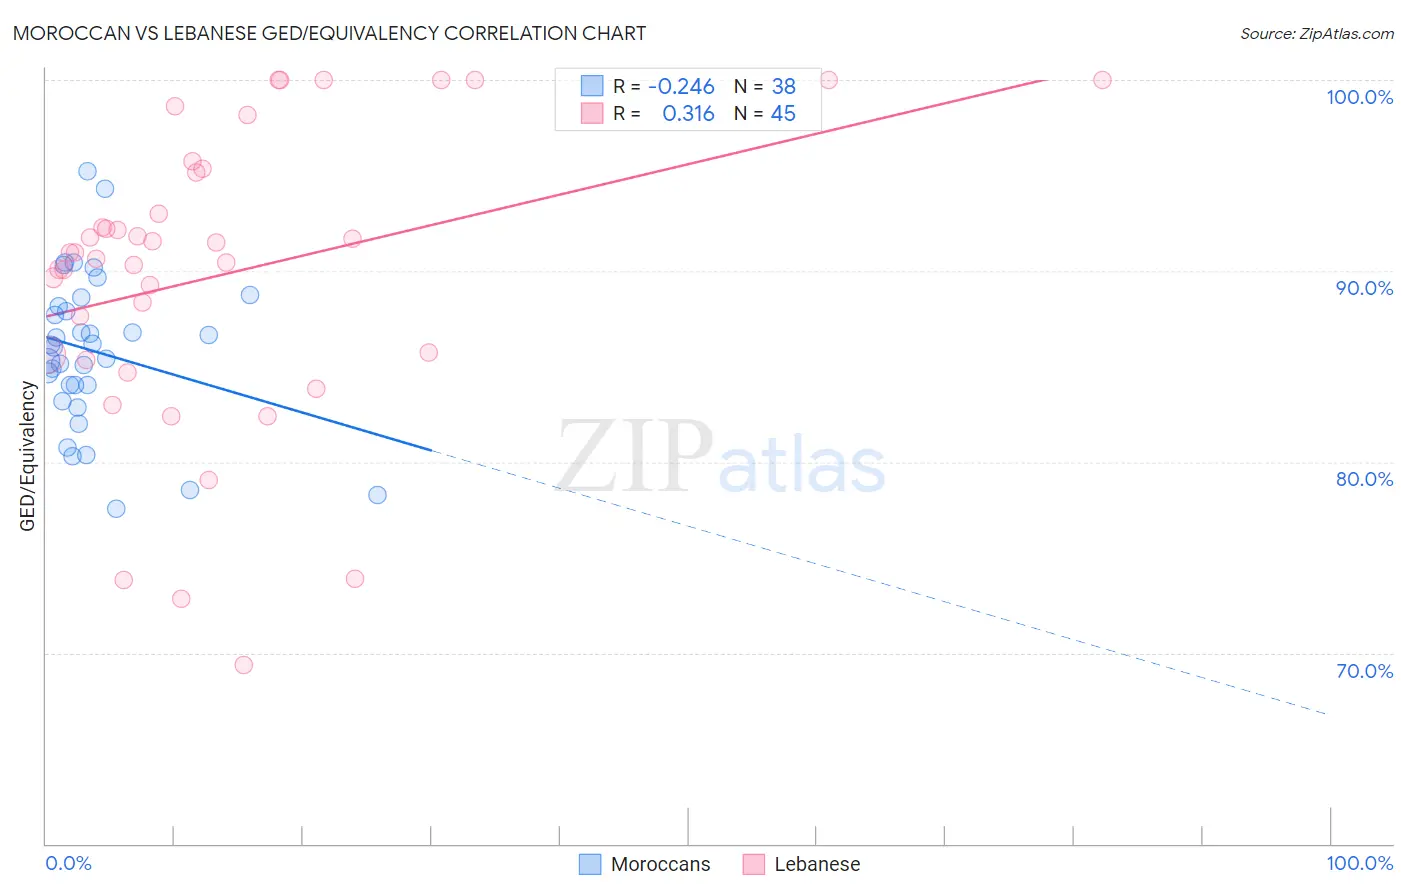
Moroccan vs Lebanese GED/Equivalency Correlation Chart
The statistical analysis conducted on geographies consisting of 201,817,353 people shows a weak negative correlation between the proportion of Moroccans and percentage of population with at least ged/equivalency education in the United States with a correlation coefficient (R) of -0.246 and weighted average of 85.5%. Similarly, the statistical analysis conducted on geographies consisting of 401,624,313 people shows a mild positive correlation between the proportion of Lebanese and percentage of population with at least ged/equivalency education in the United States with a correlation coefficient (R) of 0.316 and weighted average of 87.2%, a difference of 1.9%.
GED/Equivalency Correlation Summary
| Measurement | Moroccan | Lebanese |
| Minimum | 77.5% | 69.4% |
| Maximum | 95.2% | 100.0% |
| Range | 17.7% | 30.6% |
| Mean | 85.8% | 89.8% |
| Median | 86.1% | 90.9% |
| Interquartile 25% (IQ1) | 84.0% | 85.5% |
| Interquartile 75% (IQ3) | 88.2% | 95.2% |
| Interquartile Range (IQR) | 4.2% | 9.8% |
| Standard Deviation (Sample) | 4.0% | 7.7% |
| Standard Deviation (Population) | 4.0% | 7.6% |
Similar Demographics by GED/Equivalency
Demographics Similar to Moroccans by GED/Equivalency
In terms of ged/equivalency, the demographic groups most similar to Moroccans are Immigrants from Southern Europe (85.5%, a difference of 0.020%), Aleut (85.6%, a difference of 0.060%), Sudanese (85.5%, a difference of 0.060%), Korean (85.6%, a difference of 0.080%), and Immigrants from Sudan (85.5%, a difference of 0.080%).
| Demographics | Rating | Rank | GED/Equivalency |
| Ottawa | 50.0 /100 | #174 | Average 85.8% |
| Immigrants | Bolivia | 49.8 /100 | #175 | Average 85.8% |
| Immigrants | Eastern Africa | 47.7 /100 | #176 | Average 85.7% |
| Immigrants | Uganda | 45.2 /100 | #177 | Average 85.7% |
| Koreans | 41.2 /100 | #178 | Average 85.6% |
| Aleuts | 40.5 /100 | #179 | Average 85.6% |
| Immigrants | Southern Europe | 38.4 /100 | #180 | Fair 85.5% |
| Moroccans | 37.7 /100 | #181 | Fair 85.5% |
| Sudanese | 35.2 /100 | #182 | Fair 85.5% |
| Immigrants | Sudan | 34.2 /100 | #183 | Fair 85.5% |
| Immigrants | Oceania | 33.6 /100 | #184 | Fair 85.5% |
| Spanish | 32.8 /100 | #185 | Fair 85.4% |
| Spaniards | 31.9 /100 | #186 | Fair 85.4% |
| Immigrants | Afghanistan | 29.8 /100 | #187 | Fair 85.4% |
| Immigrants | Sierra Leone | 29.0 /100 | #188 | Fair 85.4% |
Demographics Similar to Lebanese by GED/Equivalency
In terms of ged/equivalency, the demographic groups most similar to Lebanese are Jordanian (87.2%, a difference of 0.010%), Immigrants from Hungary (87.2%, a difference of 0.020%), Indian (Asian) (87.1%, a difference of 0.030%), Immigrants from Zimbabwe (87.1%, a difference of 0.050%), and Syrian (87.2%, a difference of 0.060%).
| Demographics | Rating | Rank | GED/Equivalency |
| Immigrants | Greece | 97.7 /100 | #95 | Exceptional 87.4% |
| Czechoslovakians | 97.6 /100 | #96 | Exceptional 87.4% |
| Immigrants | Western Europe | 97.3 /100 | #97 | Exceptional 87.3% |
| Immigrants | Croatia | 96.9 /100 | #98 | Exceptional 87.3% |
| Immigrants | Belarus | 96.9 /100 | #99 | Exceptional 87.3% |
| Palestinians | 96.8 /100 | #100 | Exceptional 87.3% |
| Syrians | 96.6 /100 | #101 | Exceptional 87.2% |
| Lebanese | 96.2 /100 | #102 | Exceptional 87.2% |
| Jordanians | 96.1 /100 | #103 | Exceptional 87.2% |
| Immigrants | Hungary | 96.0 /100 | #104 | Exceptional 87.2% |
| Indians (Asian) | 95.9 /100 | #105 | Exceptional 87.1% |
| Immigrants | Zimbabwe | 95.8 /100 | #106 | Exceptional 87.1% |
| Icelanders | 95.7 /100 | #107 | Exceptional 87.1% |
| Canadians | 95.6 /100 | #108 | Exceptional 87.1% |
| Immigrants | Eastern Europe | 95.5 /100 | #109 | Exceptional 87.1% |