Lumbee vs Immigrants from Panama 8th Grade
COMPARE
Lumbee
Immigrants from Panama
8th Grade
8th Grade Comparison
Lumbee
Immigrants from Panama
96.0%
8TH GRADE
84.1/ 100
METRIC RATING
145th/ 347
METRIC RANK
95.2%
8TH GRADE
4.1/ 100
METRIC RATING
230th/ 347
METRIC RANK
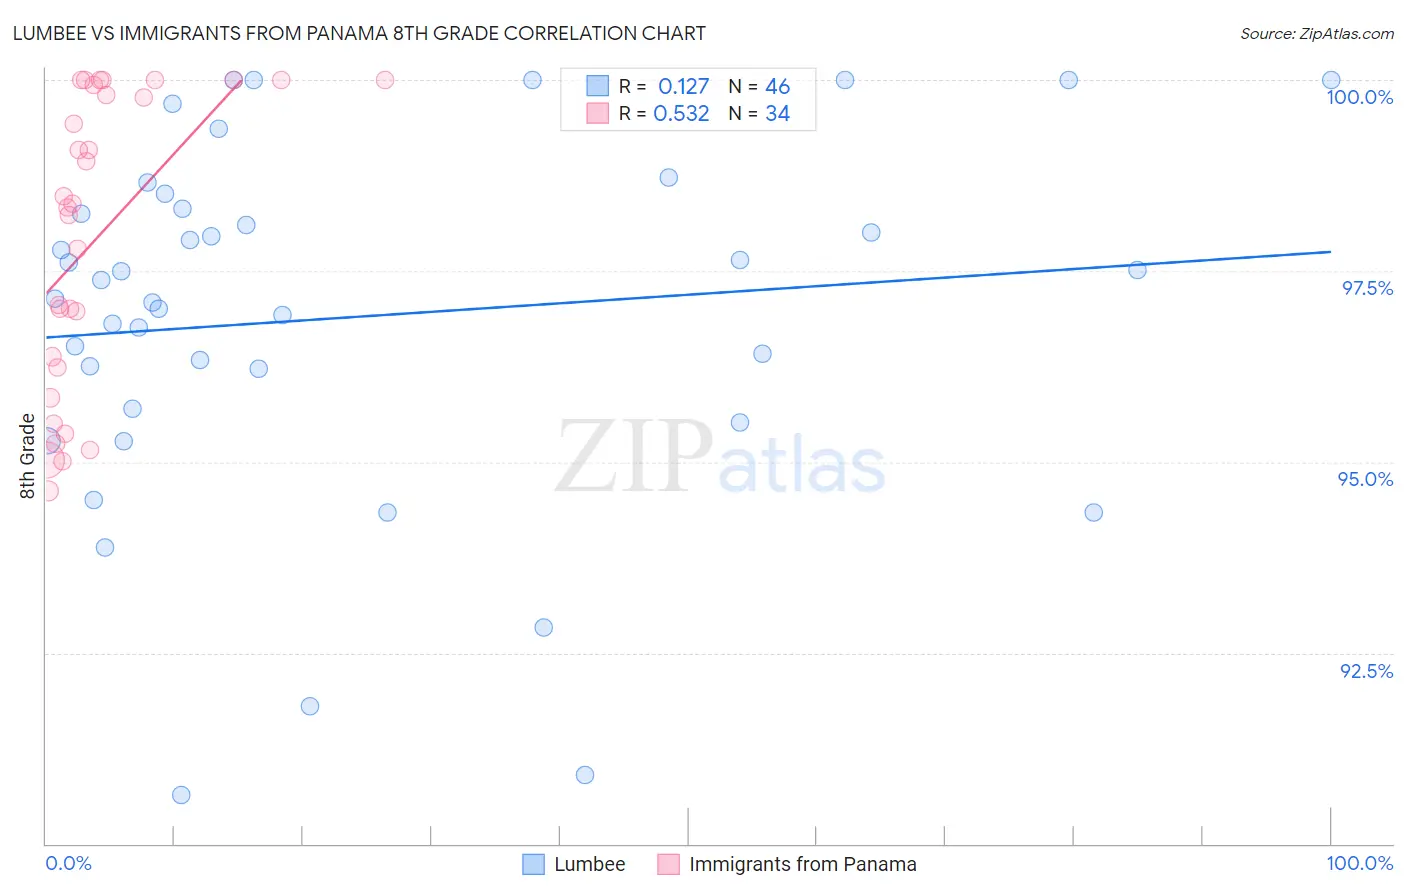
Lumbee vs Immigrants from Panama 8th Grade Correlation Chart
The statistical analysis conducted on geographies consisting of 92,298,865 people shows a poor positive correlation between the proportion of Lumbee and percentage of population with at least 8th grade education in the United States with a correlation coefficient (R) of 0.127 and weighted average of 96.0%. Similarly, the statistical analysis conducted on geographies consisting of 221,181,539 people shows a substantial positive correlation between the proportion of Immigrants from Panama and percentage of population with at least 8th grade education in the United States with a correlation coefficient (R) of 0.532 and weighted average of 95.2%, a difference of 0.79%.
8th Grade Correlation Summary
| Measurement | Lumbee | Immigrants from Panama |
| Minimum | 90.6% | 94.6% |
| Maximum | 100.0% | 100.0% |
| Range | 9.4% | 5.4% |
| Mean | 96.9% | 97.9% |
| Median | 97.3% | 98.4% |
| Interquartile 25% (IQ1) | 95.7% | 96.2% |
| Interquartile 75% (IQ3) | 98.3% | 99.9% |
| Interquartile Range (IQR) | 2.6% | 3.7% |
| Standard Deviation (Sample) | 2.3% | 1.9% |
| Standard Deviation (Population) | 2.3% | 1.9% |
Similar Demographics by 8th Grade
Demographics Similar to Lumbee by 8th Grade
In terms of 8th grade, the demographic groups most similar to Lumbee are Israeli (96.0%, a difference of 0.0%), Colville (96.0%, a difference of 0.0%), Spanish (96.0%, a difference of 0.010%), Immigrants from Belarus (96.0%, a difference of 0.010%), and Albanian (96.0%, a difference of 0.010%).
| Demographics | Rating | Rank | 8th Grade |
| Burmese | 90.2 /100 | #138 | Exceptional 96.1% |
| Hmong | 89.7 /100 | #139 | Excellent 96.1% |
| Immigrants | South Central Asia | 89.4 /100 | #140 | Excellent 96.1% |
| Immigrants | Greece | 85.9 /100 | #141 | Excellent 96.0% |
| Immigrants | Eastern Europe | 85.4 /100 | #142 | Excellent 96.0% |
| Spanish | 85.1 /100 | #143 | Excellent 96.0% |
| Immigrants | Belarus | 84.8 /100 | #144 | Excellent 96.0% |
| Lumbee | 84.1 /100 | #145 | Excellent 96.0% |
| Israelis | 84.1 /100 | #146 | Excellent 96.0% |
| Colville | 84.0 /100 | #147 | Excellent 96.0% |
| Albanians | 83.1 /100 | #148 | Excellent 96.0% |
| Immigrants | Israel | 81.3 /100 | #149 | Excellent 96.0% |
| Immigrants | Russia | 80.9 /100 | #150 | Excellent 96.0% |
| Blackfeet | 80.8 /100 | #151 | Excellent 96.0% |
| French American Indians | 80.6 /100 | #152 | Excellent 96.0% |
Demographics Similar to Immigrants from Panama by 8th Grade
In terms of 8th grade, the demographic groups most similar to Immigrants from Panama are Immigrants from Indonesia (95.3%, a difference of 0.010%), Asian (95.2%, a difference of 0.030%), Indian (Asian) (95.2%, a difference of 0.030%), Bahamian (95.3%, a difference of 0.050%), and Immigrants from Eastern Africa (95.3%, a difference of 0.050%).
| Demographics | Rating | Rank | 8th Grade |
| Immigrants | Oceania | 7.1 /100 | #223 | Tragic 95.3% |
| Immigrants | Western Asia | 6.0 /100 | #224 | Tragic 95.3% |
| Sub-Saharan Africans | 6.0 /100 | #225 | Tragic 95.3% |
| Navajo | 5.7 /100 | #226 | Tragic 95.3% |
| Bahamians | 5.6 /100 | #227 | Tragic 95.3% |
| Immigrants | Eastern Africa | 5.6 /100 | #228 | Tragic 95.3% |
| Immigrants | Indonesia | 4.4 /100 | #229 | Tragic 95.3% |
| Immigrants | Panama | 4.1 /100 | #230 | Tragic 95.2% |
| Asians | 3.5 /100 | #231 | Tragic 95.2% |
| Indians (Asian) | 3.3 /100 | #232 | Tragic 95.2% |
| Immigrants | Asia | 3.1 /100 | #233 | Tragic 95.2% |
| Costa Ricans | 3.0 /100 | #234 | Tragic 95.2% |
| Nigerians | 2.9 /100 | #235 | Tragic 95.2% |
| Senegalese | 2.7 /100 | #236 | Tragic 95.2% |
| Immigrants | Africa | 2.7 /100 | #237 | Tragic 95.2% |