Somali vs Immigrants from Panama Bachelor's Degree
COMPARE
Somali
Immigrants from Panama
Bachelor's Degree
Bachelor's Degree Comparison
Somalis
Immigrants from Panama
38.1%
BACHELOR'S DEGREE
58.6/ 100
METRIC RATING
166th/ 347
METRIC RANK
36.2%
BACHELOR'S DEGREE
14.2/ 100
METRIC RATING
213th/ 347
METRIC RANK
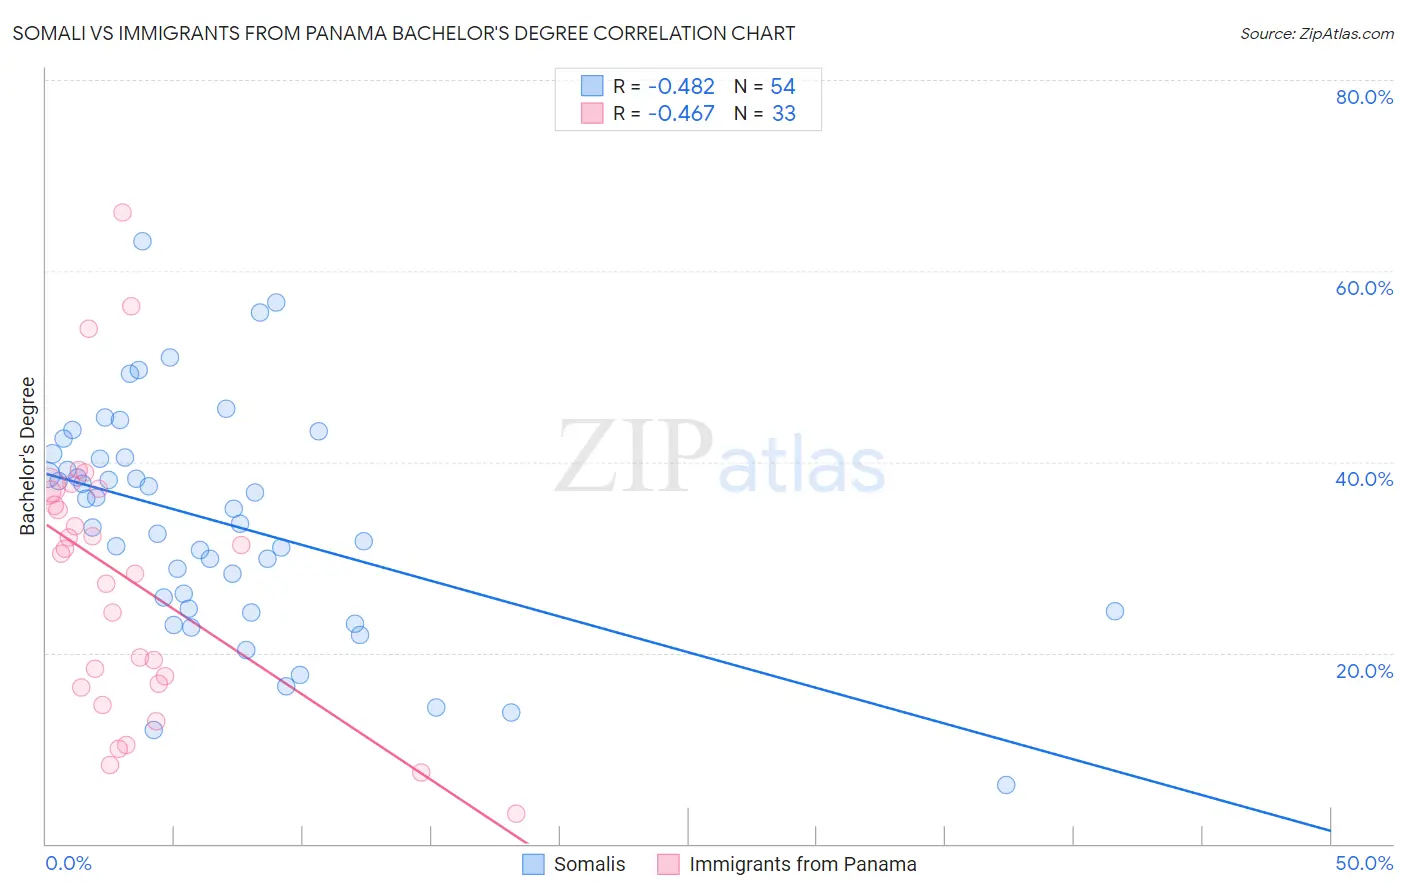
Somali vs Immigrants from Panama Bachelor's Degree Correlation Chart
The statistical analysis conducted on geographies consisting of 99,325,880 people shows a moderate negative correlation between the proportion of Somalis and percentage of population with at least bachelor's degree education in the United States with a correlation coefficient (R) of -0.482 and weighted average of 38.1%. Similarly, the statistical analysis conducted on geographies consisting of 221,180,522 people shows a moderate negative correlation between the proportion of Immigrants from Panama and percentage of population with at least bachelor's degree education in the United States with a correlation coefficient (R) of -0.467 and weighted average of 36.2%, a difference of 5.5%.
Bachelor's Degree Correlation Summary
| Measurement | Somali | Immigrants from Panama |
| Minimum | 6.2% | 3.2% |
| Maximum | 63.1% | 66.2% |
| Range | 56.9% | 63.0% |
| Mean | 33.6% | 27.8% |
| Median | 34.3% | 30.3% |
| Interquartile 25% (IQ1) | 24.6% | 16.6% |
| Interquartile 75% (IQ3) | 40.5% | 37.0% |
| Interquartile Range (IQR) | 15.9% | 20.5% |
| Standard Deviation (Sample) | 11.8% | 14.6% |
| Standard Deviation (Population) | 11.7% | 14.4% |
Similar Demographics by Bachelor's Degree
Demographics Similar to Somalis by Bachelor's Degree
In terms of bachelor's degree, the demographic groups most similar to Somalis are Sri Lankan (38.2%, a difference of 0.050%), Scottish (38.1%, a difference of 0.21%), Danish (38.1%, a difference of 0.24%), Ghanaian (38.0%, a difference of 0.33%), and Hungarian (38.3%, a difference of 0.35%).
| Demographics | Rating | Rank | Bachelor's Degree |
| Chinese | 66.6 /100 | #159 | Good 38.5% |
| Vietnamese | 66.6 /100 | #160 | Good 38.5% |
| Uruguayans | 65.8 /100 | #161 | Good 38.4% |
| Colombians | 65.0 /100 | #162 | Good 38.4% |
| Peruvians | 63.4 /100 | #163 | Good 38.3% |
| Hungarians | 62.1 /100 | #164 | Good 38.3% |
| Sri Lankans | 59.1 /100 | #165 | Average 38.2% |
| Somalis | 58.6 /100 | #166 | Average 38.1% |
| Scottish | 56.6 /100 | #167 | Average 38.1% |
| Danes | 56.2 /100 | #168 | Average 38.1% |
| Ghanaians | 55.3 /100 | #169 | Average 38.0% |
| Czechs | 54.4 /100 | #170 | Average 38.0% |
| Bermudans | 54.2 /100 | #171 | Average 38.0% |
| Immigrants | Somalia | 52.8 /100 | #172 | Average 37.9% |
| Immigrants | Iraq | 52.5 /100 | #173 | Average 37.9% |
Demographics Similar to Immigrants from Panama by Bachelor's Degree
In terms of bachelor's degree, the demographic groups most similar to Immigrants from Panama are German (36.1%, a difference of 0.060%), Immigrants from Western Africa (36.1%, a difference of 0.10%), Barbadian (36.1%, a difference of 0.16%), Immigrants from Philippines (36.4%, a difference of 0.68%), and Scotch-Irish (36.4%, a difference of 0.76%).
| Demographics | Rating | Rank | Bachelor's Degree |
| Spaniards | 21.2 /100 | #206 | Fair 36.6% |
| Immigrants | Middle Africa | 20.6 /100 | #207 | Fair 36.6% |
| Immigrants | Thailand | 19.4 /100 | #208 | Poor 36.5% |
| Panamanians | 18.8 /100 | #209 | Poor 36.5% |
| French | 18.6 /100 | #210 | Poor 36.5% |
| Scotch-Irish | 18.3 /100 | #211 | Poor 36.4% |
| Immigrants | Philippines | 17.8 /100 | #212 | Poor 36.4% |
| Immigrants | Panama | 14.2 /100 | #213 | Poor 36.2% |
| Germans | 13.9 /100 | #214 | Poor 36.1% |
| Immigrants | Western Africa | 13.8 /100 | #215 | Poor 36.1% |
| Barbadians | 13.5 /100 | #216 | Poor 36.1% |
| German Russians | 10.2 /100 | #217 | Poor 35.8% |
| Sub-Saharan Africans | 9.8 /100 | #218 | Tragic 35.8% |
| West Indians | 9.7 /100 | #219 | Tragic 35.8% |
| Spanish | 9.6 /100 | #220 | Tragic 35.8% |