Indonesian vs Immigrants from Panama Bachelor's Degree
COMPARE
Indonesian
Immigrants from Panama
Bachelor's Degree
Bachelor's Degree Comparison
Indonesians
Immigrants from Panama
33.5%
BACHELOR'S DEGREE
0.9/ 100
METRIC RATING
250th/ 347
METRIC RANK
36.2%
BACHELOR'S DEGREE
14.2/ 100
METRIC RATING
213th/ 347
METRIC RANK
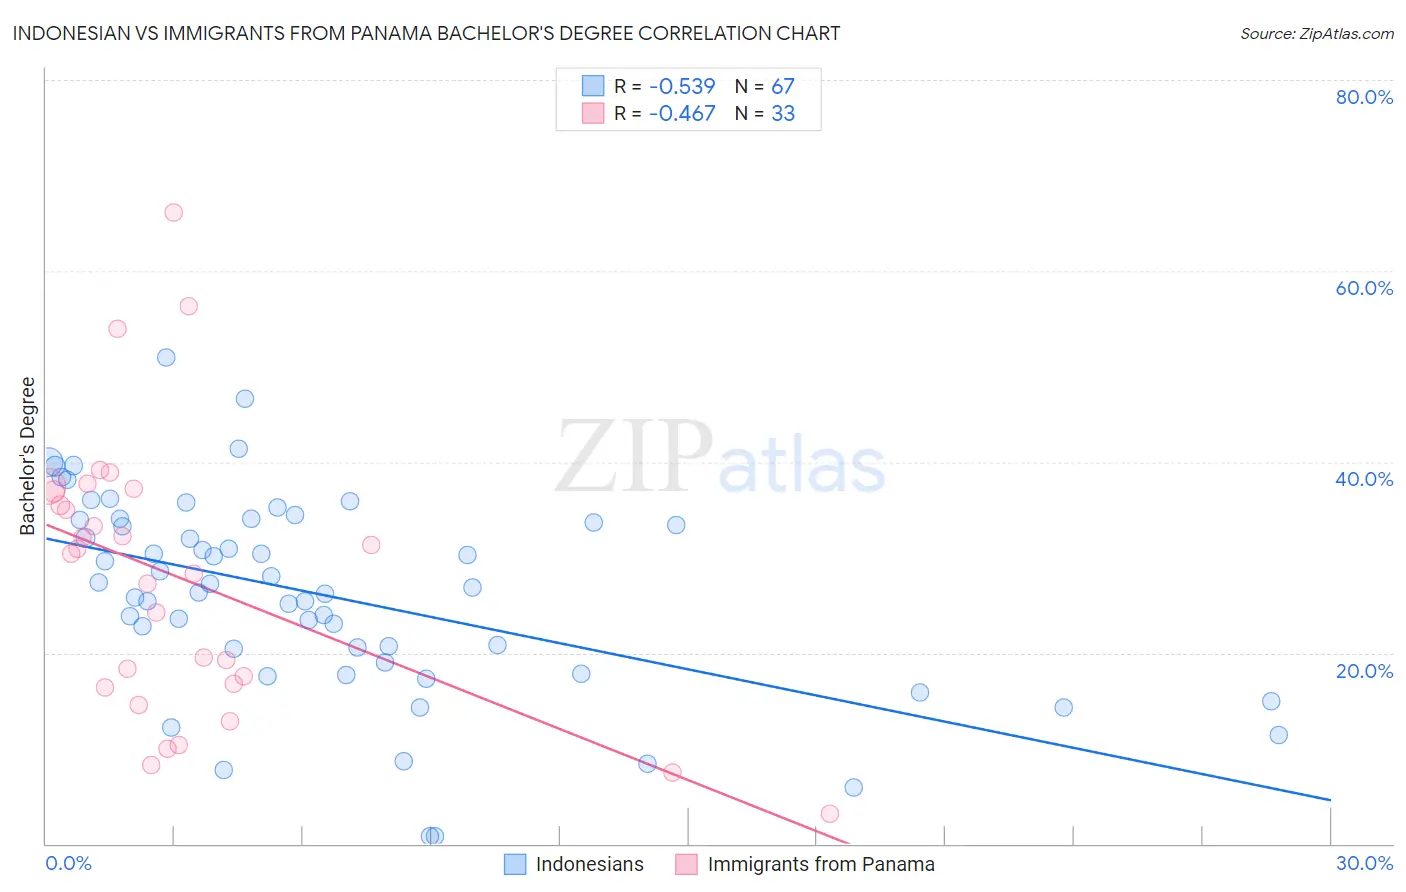
Indonesian vs Immigrants from Panama Bachelor's Degree Correlation Chart
The statistical analysis conducted on geographies consisting of 162,716,505 people shows a substantial negative correlation between the proportion of Indonesians and percentage of population with at least bachelor's degree education in the United States with a correlation coefficient (R) of -0.539 and weighted average of 33.5%. Similarly, the statistical analysis conducted on geographies consisting of 221,180,522 people shows a moderate negative correlation between the proportion of Immigrants from Panama and percentage of population with at least bachelor's degree education in the United States with a correlation coefficient (R) of -0.467 and weighted average of 36.2%, a difference of 7.9%.
Bachelor's Degree Correlation Summary
| Measurement | Indonesian | Immigrants from Panama |
| Minimum | 0.73% | 3.2% |
| Maximum | 50.9% | 66.2% |
| Range | 50.2% | 63.0% |
| Mean | 26.1% | 27.8% |
| Median | 26.9% | 30.3% |
| Interquartile 25% (IQ1) | 19.0% | 16.6% |
| Interquartile 75% (IQ3) | 33.9% | 37.0% |
| Interquartile Range (IQR) | 14.9% | 20.5% |
| Standard Deviation (Sample) | 10.5% | 14.6% |
| Standard Deviation (Population) | 10.4% | 14.4% |
Similar Demographics by Bachelor's Degree
Demographics Similar to Indonesians by Bachelor's Degree
In terms of bachelor's degree, the demographic groups most similar to Indonesians are Immigrants from Liberia (33.5%, a difference of 0.010%), Cree (33.6%, a difference of 0.13%), Immigrants from Congo (33.6%, a difference of 0.15%), Jamaican (33.6%, a difference of 0.24%), and Immigrants from Fiji (33.7%, a difference of 0.60%).
| Demographics | Rating | Rank | Bachelor's Degree |
| Immigrants | Guyana | 1.4 /100 | #243 | Tragic 33.9% |
| Delaware | 1.2 /100 | #244 | Tragic 33.8% |
| Immigrants | Fiji | 1.2 /100 | #245 | Tragic 33.7% |
| Jamaicans | 1.0 /100 | #246 | Tragic 33.6% |
| Immigrants | Congo | 1.0 /100 | #247 | Tragic 33.6% |
| Cree | 1.0 /100 | #248 | Tragic 33.6% |
| Immigrants | Liberia | 0.9 /100 | #249 | Tragic 33.5% |
| Indonesians | 0.9 /100 | #250 | Tragic 33.5% |
| Japanese | 0.7 /100 | #251 | Tragic 33.3% |
| Immigrants | Bahamas | 0.7 /100 | #252 | Tragic 33.3% |
| U.S. Virgin Islanders | 0.7 /100 | #253 | Tragic 33.2% |
| Native Hawaiians | 0.7 /100 | #254 | Tragic 33.2% |
| Iroquois | 0.7 /100 | #255 | Tragic 33.2% |
| Nicaraguans | 0.6 /100 | #256 | Tragic 33.1% |
| Spanish Americans | 0.6 /100 | #257 | Tragic 33.1% |
Demographics Similar to Immigrants from Panama by Bachelor's Degree
In terms of bachelor's degree, the demographic groups most similar to Immigrants from Panama are German (36.1%, a difference of 0.060%), Immigrants from Western Africa (36.1%, a difference of 0.10%), Barbadian (36.1%, a difference of 0.16%), Immigrants from Philippines (36.4%, a difference of 0.68%), and Scotch-Irish (36.4%, a difference of 0.76%).
| Demographics | Rating | Rank | Bachelor's Degree |
| Spaniards | 21.2 /100 | #206 | Fair 36.6% |
| Immigrants | Middle Africa | 20.6 /100 | #207 | Fair 36.6% |
| Immigrants | Thailand | 19.4 /100 | #208 | Poor 36.5% |
| Panamanians | 18.8 /100 | #209 | Poor 36.5% |
| French | 18.6 /100 | #210 | Poor 36.5% |
| Scotch-Irish | 18.3 /100 | #211 | Poor 36.4% |
| Immigrants | Philippines | 17.8 /100 | #212 | Poor 36.4% |
| Immigrants | Panama | 14.2 /100 | #213 | Poor 36.2% |
| Germans | 13.9 /100 | #214 | Poor 36.1% |
| Immigrants | Western Africa | 13.8 /100 | #215 | Poor 36.1% |
| Barbadians | 13.5 /100 | #216 | Poor 36.1% |
| German Russians | 10.2 /100 | #217 | Poor 35.8% |
| Sub-Saharan Africans | 9.8 /100 | #218 | Tragic 35.8% |
| West Indians | 9.7 /100 | #219 | Tragic 35.8% |
| Spanish | 9.6 /100 | #220 | Tragic 35.8% |