Lumbee vs Filipino In Labor Force | Age 45-54
COMPARE
Lumbee
Filipino
In Labor Force | Age 45-54
In Labor Force | Age 45-54 Comparison
Lumbee
Filipinos
75.6%
IN LABOR FORCE | AGE 45-54
0.0/ 100
METRIC RATING
340th/ 347
METRIC RANK
83.5%
IN LABOR FORCE | AGE 45-54
98.3/ 100
METRIC RATING
61st/ 347
METRIC RANK
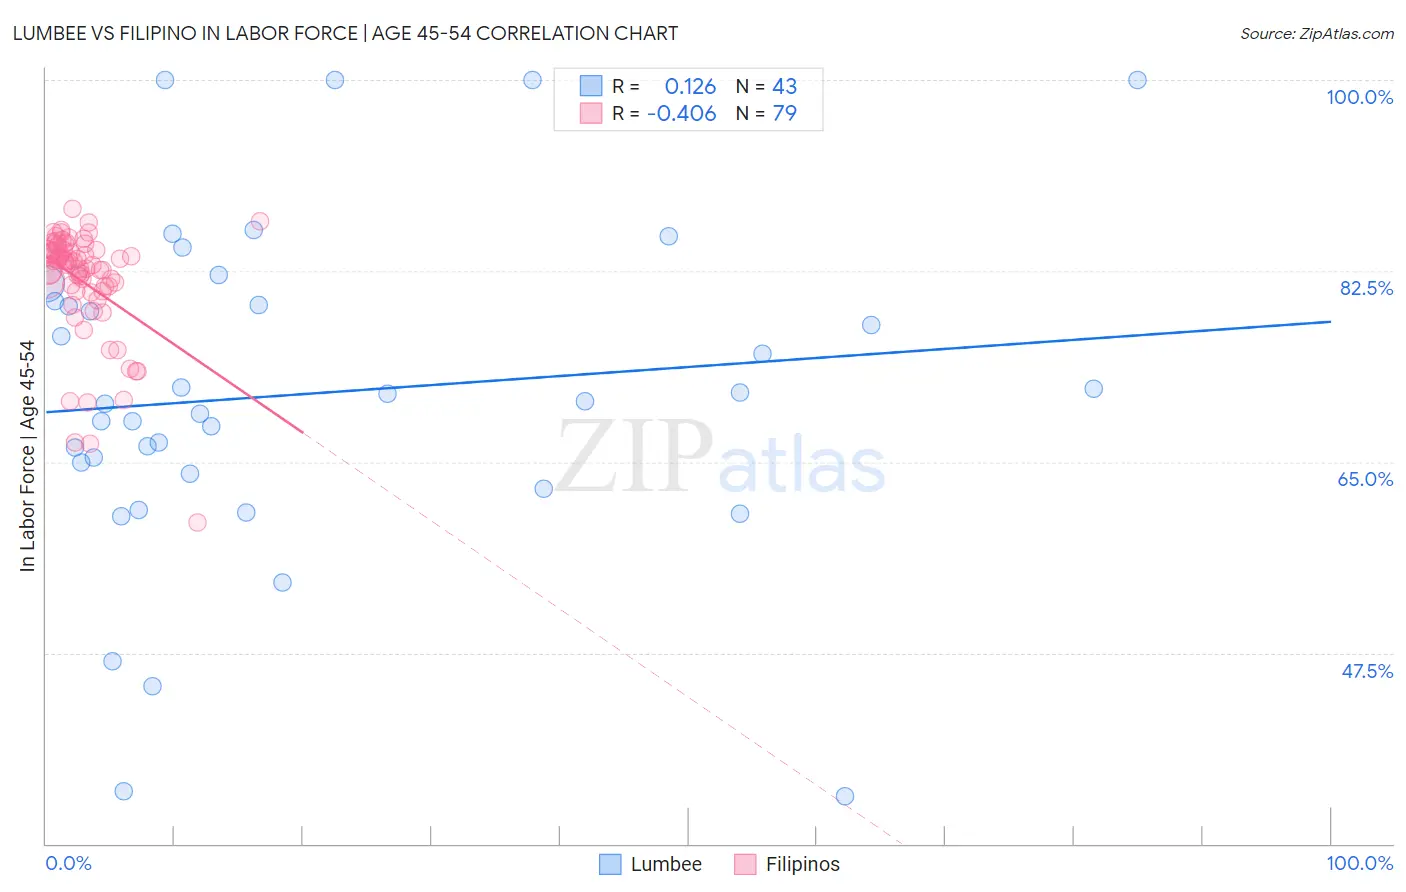
Lumbee vs Filipino In Labor Force | Age 45-54 Correlation Chart
The statistical analysis conducted on geographies consisting of 92,258,023 people shows a poor positive correlation between the proportion of Lumbee and labor force participation rate among population between the ages 45 and 54 in the United States with a correlation coefficient (R) of 0.126 and weighted average of 75.6%. Similarly, the statistical analysis conducted on geographies consisting of 254,168,663 people shows a moderate negative correlation between the proportion of Filipinos and labor force participation rate among population between the ages 45 and 54 in the United States with a correlation coefficient (R) of -0.406 and weighted average of 83.5%, a difference of 10.4%.
In Labor Force | Age 45-54 Correlation Summary
| Measurement | Lumbee | Filipino |
| Minimum | 34.3% | 59.5% |
| Maximum | 100.0% | 88.2% |
| Range | 65.7% | 28.7% |
| Mean | 71.3% | 81.5% |
| Median | 70.6% | 83.4% |
| Interquartile 25% (IQ1) | 63.9% | 80.6% |
| Interquartile 75% (IQ3) | 79.7% | 84.4% |
| Interquartile Range (IQR) | 15.8% | 3.8% |
| Standard Deviation (Sample) | 15.3% | 5.2% |
| Standard Deviation (Population) | 15.1% | 5.1% |
Similar Demographics by In Labor Force | Age 45-54
Demographics Similar to Lumbee by In Labor Force | Age 45-54
In terms of in labor force | age 45-54, the demographic groups most similar to Lumbee are Pueblo (75.5%, a difference of 0.12%), Puerto Rican (75.9%, a difference of 0.46%), Tohono O'odham (75.1%, a difference of 0.61%), Hopi (75.0%, a difference of 0.79%), and Yuman (76.3%, a difference of 0.95%).
| Demographics | Rating | Rank | In Labor Force | Age 45-54 |
| Natives/Alaskans | 0.0 /100 | #333 | Tragic 77.1% |
| Apache | 0.0 /100 | #334 | Tragic 77.1% |
| Arapaho | 0.0 /100 | #335 | Tragic 77.1% |
| Paiute | 0.0 /100 | #336 | Tragic 76.7% |
| Ute | 0.0 /100 | #337 | Tragic 76.6% |
| Yuman | 0.0 /100 | #338 | Tragic 76.3% |
| Puerto Ricans | 0.0 /100 | #339 | Tragic 75.9% |
| Lumbee | 0.0 /100 | #340 | Tragic 75.6% |
| Pueblo | 0.0 /100 | #341 | Tragic 75.5% |
| Tohono O'odham | 0.0 /100 | #342 | Tragic 75.1% |
| Hopi | 0.0 /100 | #343 | Tragic 75.0% |
| Immigrants | Yemen | 0.0 /100 | #344 | Tragic 74.4% |
| Houma | 0.0 /100 | #345 | Tragic 74.1% |
| Pima | 0.0 /100 | #346 | Tragic 72.8% |
| Navajo | 0.0 /100 | #347 | Tragic 72.8% |
Demographics Similar to Filipinos by In Labor Force | Age 45-54
In terms of in labor force | age 45-54, the demographic groups most similar to Filipinos are Carpatho Rusyn (83.5%, a difference of 0.0%), Bhutanese (83.5%, a difference of 0.010%), Eastern European (83.5%, a difference of 0.020%), Paraguayan (83.5%, a difference of 0.030%), and Immigrants from Taiwan (83.5%, a difference of 0.030%).
| Demographics | Rating | Rank | In Labor Force | Age 45-54 |
| Somalis | 98.7 /100 | #54 | Exceptional 83.5% |
| Macedonians | 98.7 /100 | #55 | Exceptional 83.5% |
| Immigrants | Peru | 98.6 /100 | #56 | Exceptional 83.5% |
| Paraguayans | 98.5 /100 | #57 | Exceptional 83.5% |
| Eastern Europeans | 98.5 /100 | #58 | Exceptional 83.5% |
| Bhutanese | 98.3 /100 | #59 | Exceptional 83.5% |
| Carpatho Rusyns | 98.3 /100 | #60 | Exceptional 83.5% |
| Filipinos | 98.3 /100 | #61 | Exceptional 83.5% |
| Immigrants | Taiwan | 98.0 /100 | #62 | Exceptional 83.5% |
| Afghans | 97.9 /100 | #63 | Exceptional 83.5% |
| Immigrants | Kenya | 97.9 /100 | #64 | Exceptional 83.5% |
| Egyptians | 97.9 /100 | #65 | Exceptional 83.5% |
| Asians | 97.7 /100 | #66 | Exceptional 83.4% |
| Chileans | 97.7 /100 | #67 | Exceptional 83.4% |
| Immigrants | Colombia | 97.6 /100 | #68 | Exceptional 83.4% |