Blackfeet vs Asian Bachelor's Degree
COMPARE
Blackfeet
Asian
Bachelor's Degree
Bachelor's Degree Comparison
Blackfeet
Asians
31.5%
BACHELOR'S DEGREE
0.1/ 100
METRIC RATING
281st/ 347
METRIC RANK
44.4%
BACHELOR'S DEGREE
99.9/ 100
METRIC RATING
51st/ 347
METRIC RANK
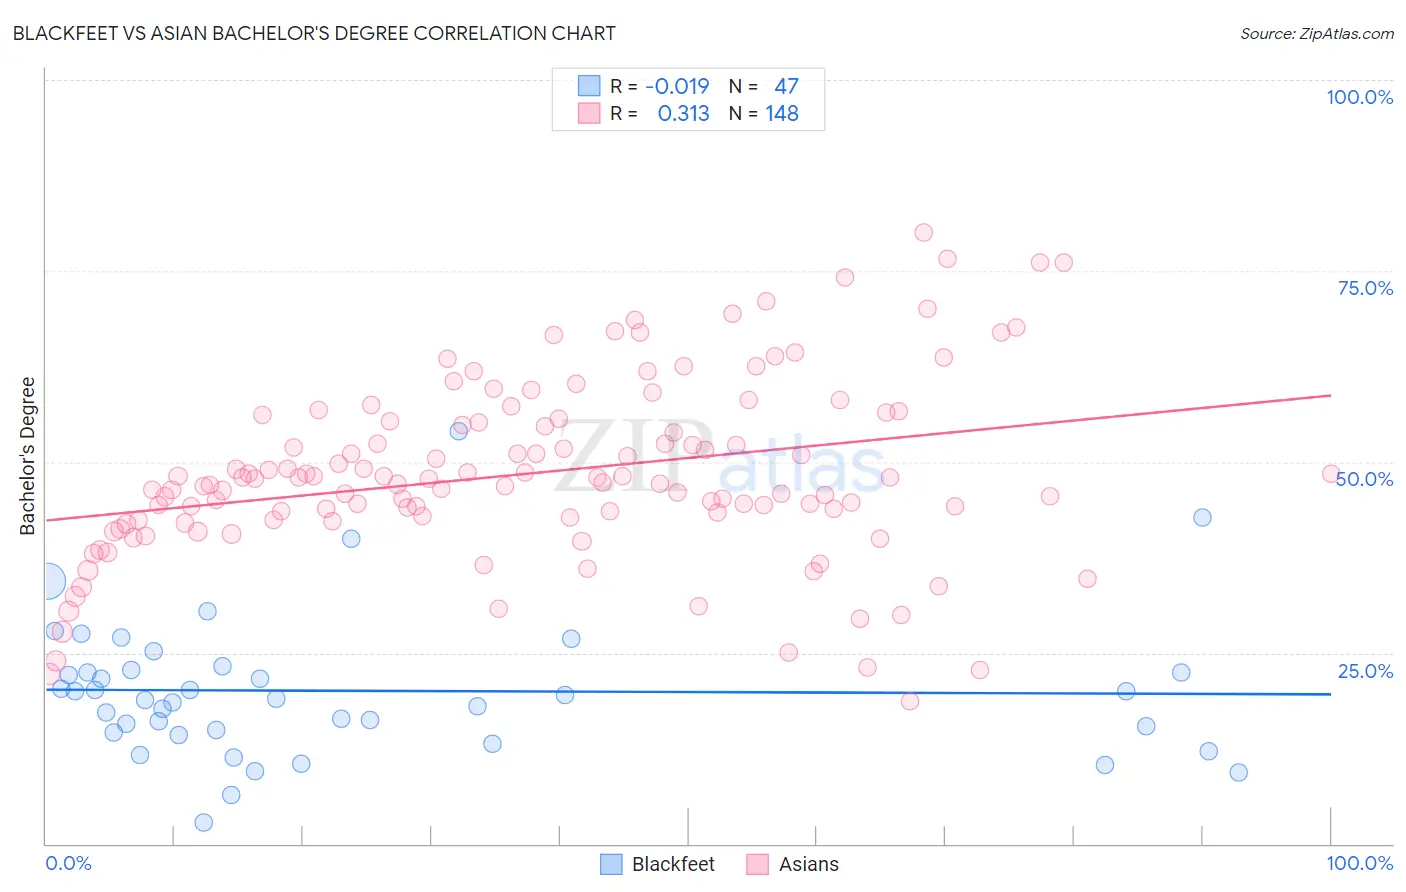
Blackfeet vs Asian Bachelor's Degree Correlation Chart
The statistical analysis conducted on geographies consisting of 309,572,502 people shows no correlation between the proportion of Blackfeet and percentage of population with at least bachelor's degree education in the United States with a correlation coefficient (R) of -0.019 and weighted average of 31.5%. Similarly, the statistical analysis conducted on geographies consisting of 550,793,799 people shows a mild positive correlation between the proportion of Asians and percentage of population with at least bachelor's degree education in the United States with a correlation coefficient (R) of 0.313 and weighted average of 44.4%, a difference of 41.1%.
Bachelor's Degree Correlation Summary
| Measurement | Blackfeet | Asian |
| Minimum | 2.7% | 18.6% |
| Maximum | 53.9% | 80.1% |
| Range | 51.2% | 61.5% |
| Mean | 20.0% | 48.5% |
| Median | 18.9% | 47.5% |
| Interquartile 25% (IQ1) | 14.5% | 42.5% |
| Interquartile 75% (IQ3) | 22.7% | 55.2% |
| Interquartile Range (IQR) | 8.2% | 12.7% |
| Standard Deviation (Sample) | 9.3% | 11.7% |
| Standard Deviation (Population) | 9.2% | 11.7% |
Similar Demographics by Bachelor's Degree
Demographics Similar to Blackfeet by Bachelor's Degree
In terms of bachelor's degree, the demographic groups most similar to Blackfeet are Immigrants from Caribbean (31.4%, a difference of 0.15%), Honduran (31.3%, a difference of 0.42%), Haitian (31.3%, a difference of 0.45%), Immigrants from Laos (31.6%, a difference of 0.46%), and Aleut (31.3%, a difference of 0.47%).
| Demographics | Rating | Rank | Bachelor's Degree |
| Potawatomi | 0.2 /100 | #274 | Tragic 31.9% |
| Samoans | 0.1 /100 | #275 | Tragic 31.8% |
| Salvadorans | 0.1 /100 | #276 | Tragic 31.8% |
| Dominicans | 0.1 /100 | #277 | Tragic 31.8% |
| Marshallese | 0.1 /100 | #278 | Tragic 31.7% |
| Hawaiians | 0.1 /100 | #279 | Tragic 31.6% |
| Immigrants | Laos | 0.1 /100 | #280 | Tragic 31.6% |
| Blackfeet | 0.1 /100 | #281 | Tragic 31.5% |
| Immigrants | Caribbean | 0.1 /100 | #282 | Tragic 31.4% |
| Hondurans | 0.1 /100 | #283 | Tragic 31.3% |
| Haitians | 0.1 /100 | #284 | Tragic 31.3% |
| Aleuts | 0.1 /100 | #285 | Tragic 31.3% |
| Immigrants | El Salvador | 0.1 /100 | #286 | Tragic 31.3% |
| Ottawa | 0.1 /100 | #287 | Tragic 31.1% |
| Guatemalans | 0.1 /100 | #288 | Tragic 31.0% |
Demographics Similar to Asians by Bachelor's Degree
In terms of bachelor's degree, the demographic groups most similar to Asians are Immigrants from Greece (44.5%, a difference of 0.14%), Immigrants from Spain (44.3%, a difference of 0.18%), Immigrants from Asia (44.3%, a difference of 0.24%), Immigrants from Norway (44.5%, a difference of 0.25%), and Bolivian (44.6%, a difference of 0.38%).
| Demographics | Rating | Rank | Bachelor's Degree |
| Immigrants | Lithuania | 99.9 /100 | #44 | Exceptional 44.6% |
| Immigrants | Kuwait | 99.9 /100 | #45 | Exceptional 44.6% |
| Immigrants | Bulgaria | 99.9 /100 | #46 | Exceptional 44.6% |
| Bolivians | 99.9 /100 | #47 | Exceptional 44.6% |
| Estonians | 99.9 /100 | #48 | Exceptional 44.6% |
| Immigrants | Norway | 99.9 /100 | #49 | Exceptional 44.5% |
| Immigrants | Greece | 99.9 /100 | #50 | Exceptional 44.5% |
| Asians | 99.9 /100 | #51 | Exceptional 44.4% |
| Immigrants | Spain | 99.9 /100 | #52 | Exceptional 44.3% |
| Immigrants | Asia | 99.9 /100 | #53 | Exceptional 44.3% |
| Immigrants | Austria | 99.9 /100 | #54 | Exceptional 44.2% |
| Immigrants | Bolivia | 99.9 /100 | #55 | Exceptional 44.2% |
| Immigrants | Serbia | 99.9 /100 | #56 | Exceptional 44.1% |
| Paraguayans | 99.9 /100 | #57 | Exceptional 44.0% |
| Immigrants | Czechoslovakia | 99.9 /100 | #58 | Exceptional 44.0% |