Immigrants from Guatemala vs Asian Bachelor's Degree
COMPARE
Immigrants from Guatemala
Asian
Bachelor's Degree
Bachelor's Degree Comparison
Immigrants from Guatemala
Asians
30.8%
BACHELOR'S DEGREE
0.0/ 100
METRIC RATING
294th/ 347
METRIC RANK
44.4%
BACHELOR'S DEGREE
99.9/ 100
METRIC RATING
51st/ 347
METRIC RANK
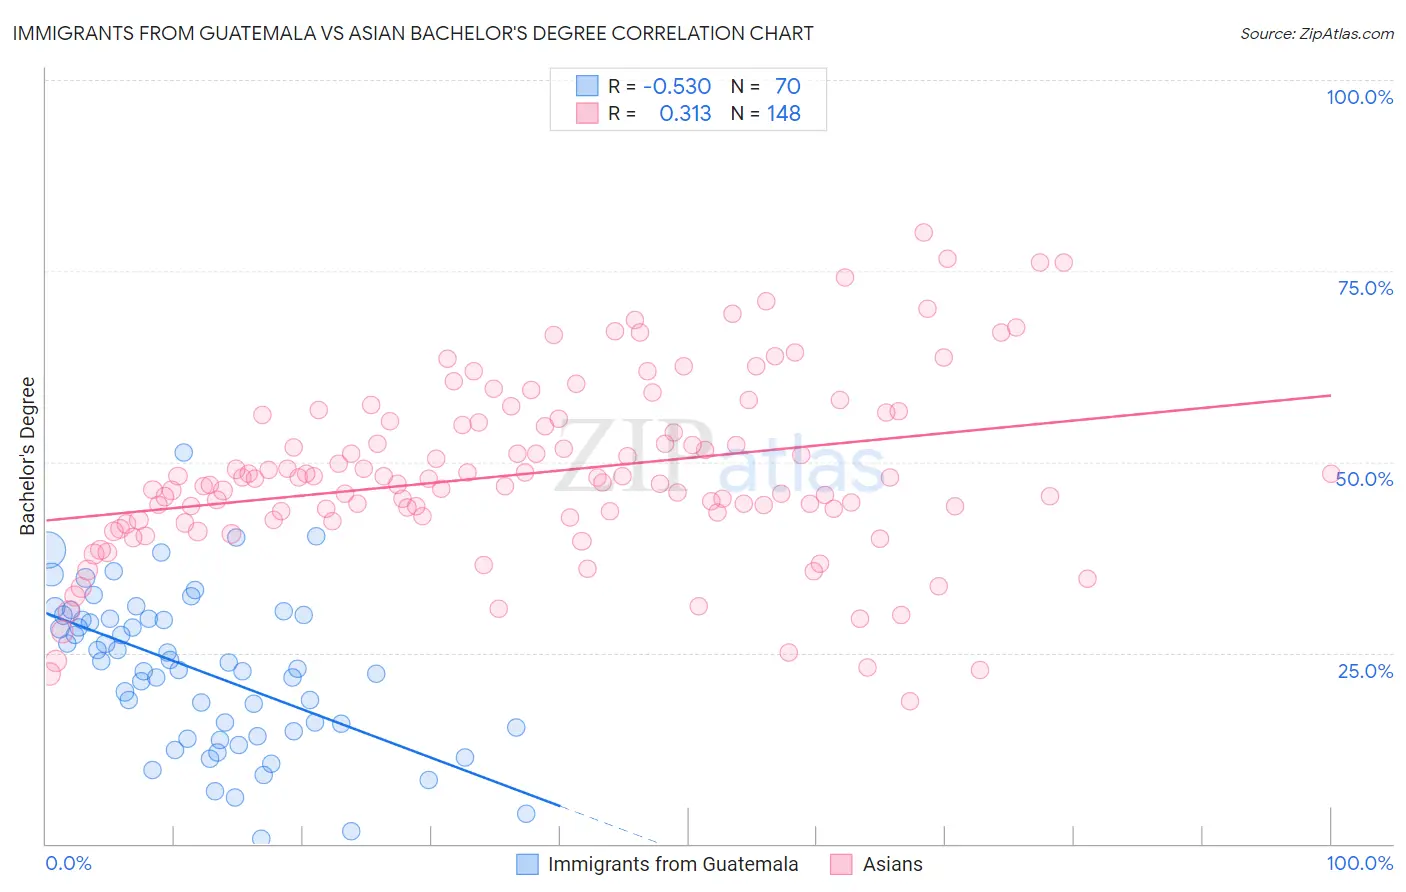
Immigrants from Guatemala vs Asian Bachelor's Degree Correlation Chart
The statistical analysis conducted on geographies consisting of 377,260,435 people shows a substantial negative correlation between the proportion of Immigrants from Guatemala and percentage of population with at least bachelor's degree education in the United States with a correlation coefficient (R) of -0.530 and weighted average of 30.8%. Similarly, the statistical analysis conducted on geographies consisting of 550,793,799 people shows a mild positive correlation between the proportion of Asians and percentage of population with at least bachelor's degree education in the United States with a correlation coefficient (R) of 0.313 and weighted average of 44.4%, a difference of 44.4%.
Bachelor's Degree Correlation Summary
| Measurement | Immigrants from Guatemala | Asian |
| Minimum | 0.73% | 18.6% |
| Maximum | 51.3% | 80.1% |
| Range | 50.6% | 61.5% |
| Mean | 22.7% | 48.5% |
| Median | 23.3% | 47.5% |
| Interquartile 25% (IQ1) | 14.7% | 42.5% |
| Interquartile 75% (IQ3) | 29.5% | 55.2% |
| Interquartile Range (IQR) | 14.7% | 12.7% |
| Standard Deviation (Sample) | 10.2% | 11.7% |
| Standard Deviation (Population) | 10.1% | 11.7% |
Similar Demographics by Bachelor's Degree
Demographics Similar to Immigrants from Guatemala by Bachelor's Degree
In terms of bachelor's degree, the demographic groups most similar to Immigrants from Guatemala are Immigrants from Dominican Republic (30.7%, a difference of 0.24%), Puget Sound Salish (30.7%, a difference of 0.34%), Cape Verdean (30.9%, a difference of 0.40%), Immigrants from Haiti (30.6%, a difference of 0.40%), and Ute (30.9%, a difference of 0.49%).
| Demographics | Rating | Rank | Bachelor's Degree |
| Ottawa | 0.1 /100 | #287 | Tragic 31.1% |
| Guatemalans | 0.1 /100 | #288 | Tragic 31.0% |
| Puerto Ricans | 0.1 /100 | #289 | Tragic 31.0% |
| Immigrants | Honduras | 0.1 /100 | #290 | Tragic 30.9% |
| Blacks/African Americans | 0.1 /100 | #291 | Tragic 30.9% |
| Ute | 0.1 /100 | #292 | Tragic 30.9% |
| Cape Verdeans | 0.1 /100 | #293 | Tragic 30.9% |
| Immigrants | Guatemala | 0.0 /100 | #294 | Tragic 30.8% |
| Immigrants | Dominican Republic | 0.0 /100 | #295 | Tragic 30.7% |
| Puget Sound Salish | 0.0 /100 | #296 | Tragic 30.7% |
| Immigrants | Haiti | 0.0 /100 | #297 | Tragic 30.6% |
| Chippewa | 0.0 /100 | #298 | Tragic 30.6% |
| Chickasaw | 0.0 /100 | #299 | Tragic 30.4% |
| Immigrants | Micronesia | 0.0 /100 | #300 | Tragic 30.4% |
| Immigrants | Cuba | 0.0 /100 | #301 | Tragic 30.3% |
Demographics Similar to Asians by Bachelor's Degree
In terms of bachelor's degree, the demographic groups most similar to Asians are Immigrants from Greece (44.5%, a difference of 0.14%), Immigrants from Spain (44.3%, a difference of 0.18%), Immigrants from Asia (44.3%, a difference of 0.24%), Immigrants from Norway (44.5%, a difference of 0.25%), and Bolivian (44.6%, a difference of 0.38%).
| Demographics | Rating | Rank | Bachelor's Degree |
| Immigrants | Lithuania | 99.9 /100 | #44 | Exceptional 44.6% |
| Immigrants | Kuwait | 99.9 /100 | #45 | Exceptional 44.6% |
| Immigrants | Bulgaria | 99.9 /100 | #46 | Exceptional 44.6% |
| Bolivians | 99.9 /100 | #47 | Exceptional 44.6% |
| Estonians | 99.9 /100 | #48 | Exceptional 44.6% |
| Immigrants | Norway | 99.9 /100 | #49 | Exceptional 44.5% |
| Immigrants | Greece | 99.9 /100 | #50 | Exceptional 44.5% |
| Asians | 99.9 /100 | #51 | Exceptional 44.4% |
| Immigrants | Spain | 99.9 /100 | #52 | Exceptional 44.3% |
| Immigrants | Asia | 99.9 /100 | #53 | Exceptional 44.3% |
| Immigrants | Austria | 99.9 /100 | #54 | Exceptional 44.2% |
| Immigrants | Bolivia | 99.9 /100 | #55 | Exceptional 44.2% |
| Immigrants | Serbia | 99.9 /100 | #56 | Exceptional 44.1% |
| Paraguayans | 99.9 /100 | #57 | Exceptional 44.0% |
| Immigrants | Czechoslovakia | 99.9 /100 | #58 | Exceptional 44.0% |