Lithuanian vs Immigrants from Sweden 11th Grade
COMPARE
Lithuanian
Immigrants from Sweden
11th Grade
11th Grade Comparison
Lithuanians
Immigrants from Sweden
94.8%
11TH GRADE
100.0/ 100
METRIC RATING
6th/ 347
METRIC RANK
93.9%
11TH GRADE
99.8/ 100
METRIC RATING
64th/ 347
METRIC RANK
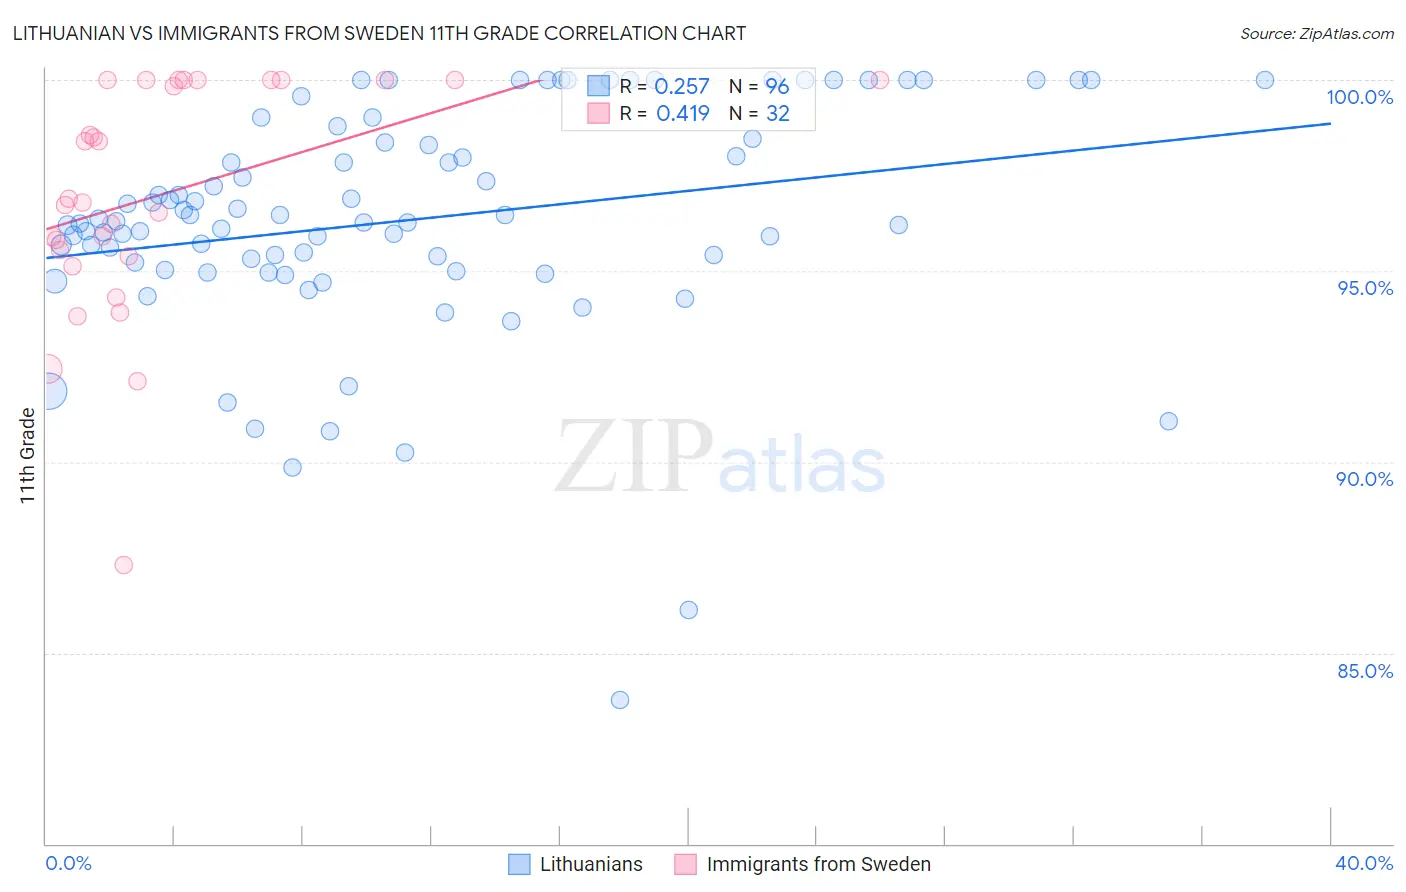
Lithuanian vs Immigrants from Sweden 11th Grade Correlation Chart
The statistical analysis conducted on geographies consisting of 421,947,832 people shows a weak positive correlation between the proportion of Lithuanians and percentage of population with at least 11th grade education in the United States with a correlation coefficient (R) of 0.257 and weighted average of 94.8%. Similarly, the statistical analysis conducted on geographies consisting of 164,736,894 people shows a moderate positive correlation between the proportion of Immigrants from Sweden and percentage of population with at least 11th grade education in the United States with a correlation coefficient (R) of 0.419 and weighted average of 93.9%, a difference of 0.92%.
11th Grade Correlation Summary
| Measurement | Lithuanian | Immigrants from Sweden |
| Minimum | 83.8% | 87.3% |
| Maximum | 100.0% | 100.0% |
| Range | 16.2% | 12.7% |
| Mean | 96.3% | 97.0% |
| Median | 96.3% | 96.8% |
| Interquartile 25% (IQ1) | 95.1% | 95.5% |
| Interquartile 75% (IQ3) | 98.4% | 100.0% |
| Interquartile Range (IQR) | 3.3% | 4.5% |
| Standard Deviation (Sample) | 3.0% | 3.0% |
| Standard Deviation (Population) | 3.0% | 3.0% |
Similar Demographics by 11th Grade
Demographics Similar to Lithuanians by 11th Grade
In terms of 11th grade, the demographic groups most similar to Lithuanians are Carpatho Rusyn (94.8%, a difference of 0.050%), Polish (94.8%, a difference of 0.050%), Croatian (94.7%, a difference of 0.060%), Danish (94.7%, a difference of 0.10%), and Slovak (94.9%, a difference of 0.11%).
| Demographics | Rating | Rank | 11th Grade |
| Norwegians | 100.0 /100 | #1 | Exceptional 95.2% |
| Swedes | 100.0 /100 | #2 | Exceptional 94.9% |
| Slovenes | 100.0 /100 | #3 | Exceptional 94.9% |
| Slovaks | 100.0 /100 | #4 | Exceptional 94.9% |
| Carpatho Rusyns | 100.0 /100 | #5 | Exceptional 94.8% |
| Lithuanians | 100.0 /100 | #6 | Exceptional 94.8% |
| Poles | 100.0 /100 | #7 | Exceptional 94.8% |
| Croatians | 100.0 /100 | #8 | Exceptional 94.7% |
| Danes | 100.0 /100 | #9 | Exceptional 94.7% |
| Finns | 100.0 /100 | #10 | Exceptional 94.7% |
| Germans | 100.0 /100 | #11 | Exceptional 94.7% |
| Latvians | 100.0 /100 | #12 | Exceptional 94.7% |
| Chinese | 100.0 /100 | #13 | Exceptional 94.6% |
| Eastern Europeans | 100.0 /100 | #14 | Exceptional 94.6% |
| Bulgarians | 100.0 /100 | #15 | Exceptional 94.5% |
Demographics Similar to Immigrants from Sweden by 11th Grade
In terms of 11th grade, the demographic groups most similar to Immigrants from Sweden are Native Hawaiian (93.9%, a difference of 0.0%), Alaskan Athabascan (93.9%, a difference of 0.020%), Immigrants from Netherlands (93.9%, a difference of 0.020%), Ukrainian (94.0%, a difference of 0.030%), and Zimbabwean (93.9%, a difference of 0.040%).
| Demographics | Rating | Rank | 11th Grade |
| New Zealanders | 99.9 /100 | #57 | Exceptional 94.0% |
| Iranians | 99.9 /100 | #58 | Exceptional 94.0% |
| Bhutanese | 99.8 /100 | #59 | Exceptional 94.0% |
| Okinawans | 99.8 /100 | #60 | Exceptional 94.0% |
| Immigrants | Belgium | 99.8 /100 | #61 | Exceptional 94.0% |
| Austrians | 99.8 /100 | #62 | Exceptional 94.0% |
| Ukrainians | 99.8 /100 | #63 | Exceptional 94.0% |
| Immigrants | Sweden | 99.8 /100 | #64 | Exceptional 93.9% |
| Native Hawaiians | 99.8 /100 | #65 | Exceptional 93.9% |
| Alaskan Athabascans | 99.8 /100 | #66 | Exceptional 93.9% |
| Immigrants | Netherlands | 99.8 /100 | #67 | Exceptional 93.9% |
| Zimbabweans | 99.8 /100 | #68 | Exceptional 93.9% |
| Scotch-Irish | 99.8 /100 | #69 | Exceptional 93.9% |
| Immigrants | England | 99.7 /100 | #70 | Exceptional 93.8% |
| Immigrants | South Africa | 99.7 /100 | #71 | Exceptional 93.8% |