Cypriot vs Immigrants from Sweden 11th Grade
COMPARE
Cypriot
Immigrants from Sweden
11th Grade
11th Grade Comparison
Cypriots
Immigrants from Sweden
94.1%
11TH GRADE
99.9/ 100
METRIC RATING
41st/ 347
METRIC RANK
93.9%
11TH GRADE
99.8/ 100
METRIC RATING
64th/ 347
METRIC RANK
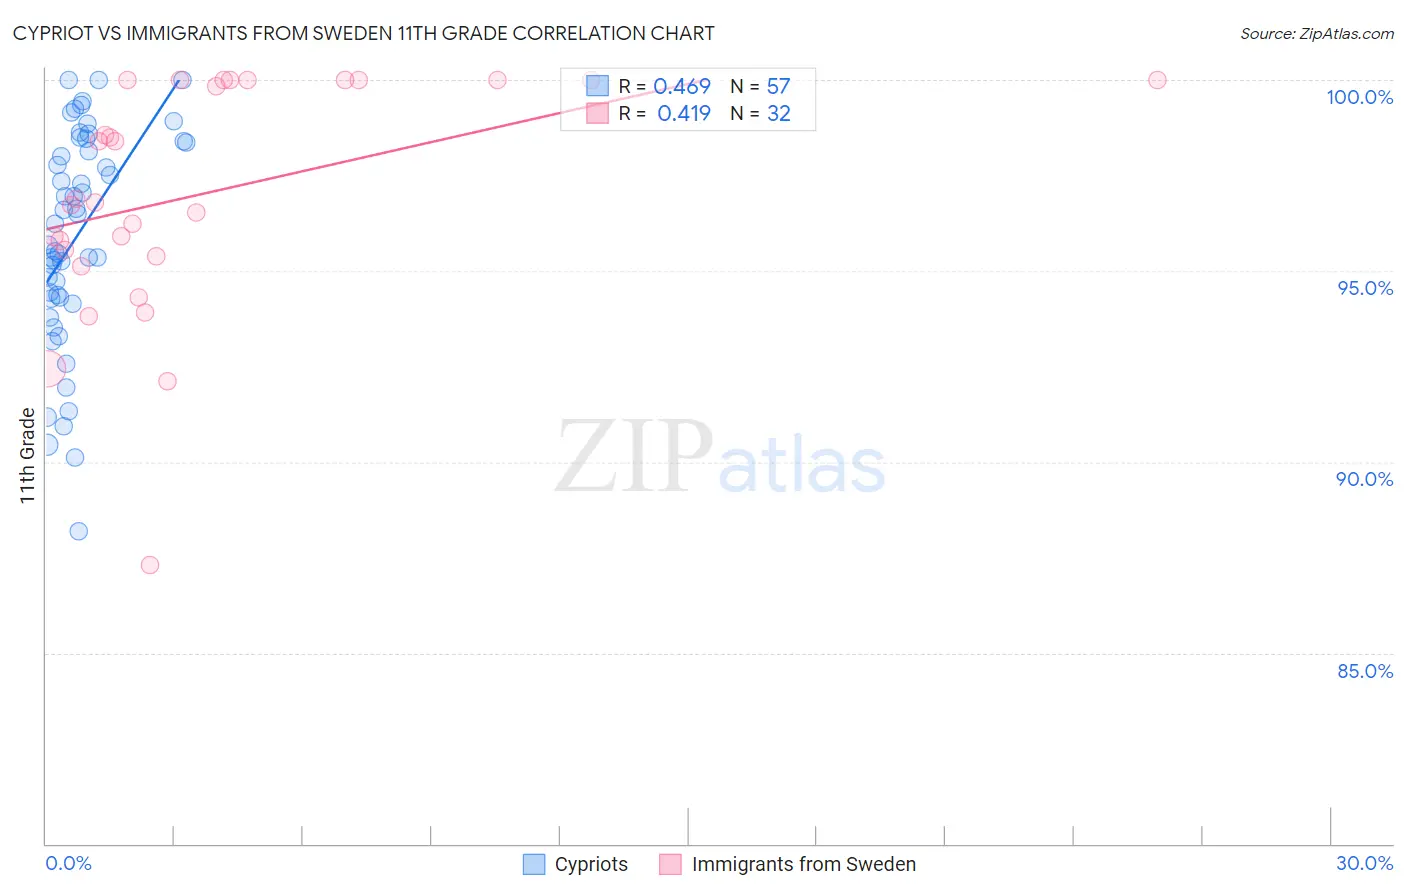
Cypriot vs Immigrants from Sweden 11th Grade Correlation Chart
The statistical analysis conducted on geographies consisting of 61,870,289 people shows a moderate positive correlation between the proportion of Cypriots and percentage of population with at least 11th grade education in the United States with a correlation coefficient (R) of 0.469 and weighted average of 94.1%. Similarly, the statistical analysis conducted on geographies consisting of 164,736,894 people shows a moderate positive correlation between the proportion of Immigrants from Sweden and percentage of population with at least 11th grade education in the United States with a correlation coefficient (R) of 0.419 and weighted average of 93.9%, a difference of 0.20%.
11th Grade Correlation Summary
| Measurement | Cypriot | Immigrants from Sweden |
| Minimum | 88.2% | 87.3% |
| Maximum | 100.0% | 100.0% |
| Range | 11.8% | 12.7% |
| Mean | 95.9% | 97.0% |
| Median | 96.2% | 96.8% |
| Interquartile 25% (IQ1) | 94.3% | 95.5% |
| Interquartile 75% (IQ3) | 98.4% | 100.0% |
| Interquartile Range (IQR) | 4.1% | 4.5% |
| Standard Deviation (Sample) | 2.8% | 3.0% |
| Standard Deviation (Population) | 2.8% | 3.0% |
Similar Demographics by 11th Grade
Demographics Similar to Cypriots by 11th Grade
In terms of 11th grade, the demographic groups most similar to Cypriots are Immigrants from Lithuania (94.1%, a difference of 0.010%), Thai (94.1%, a difference of 0.010%), Immigrants from Austria (94.1%, a difference of 0.010%), Greek (94.1%, a difference of 0.010%), and Immigrants from Ireland (94.1%, a difference of 0.020%).
| Demographics | Rating | Rank | 11th Grade |
| Immigrants | Scotland | 99.9 /100 | #34 | Exceptional 94.2% |
| Immigrants | Singapore | 99.9 /100 | #35 | Exceptional 94.2% |
| Immigrants | Northern Europe | 99.9 /100 | #36 | Exceptional 94.2% |
| Northern Europeans | 99.9 /100 | #37 | Exceptional 94.2% |
| Hungarians | 99.9 /100 | #38 | Exceptional 94.2% |
| Immigrants | Lithuania | 99.9 /100 | #39 | Exceptional 94.1% |
| Thais | 99.9 /100 | #40 | Exceptional 94.1% |
| Cypriots | 99.9 /100 | #41 | Exceptional 94.1% |
| Immigrants | Austria | 99.9 /100 | #42 | Exceptional 94.1% |
| Greeks | 99.9 /100 | #43 | Exceptional 94.1% |
| Immigrants | Ireland | 99.9 /100 | #44 | Exceptional 94.1% |
| Australians | 99.9 /100 | #45 | Exceptional 94.1% |
| Serbians | 99.9 /100 | #46 | Exceptional 94.1% |
| Filipinos | 99.9 /100 | #47 | Exceptional 94.1% |
| Macedonians | 99.9 /100 | #48 | Exceptional 94.1% |
Demographics Similar to Immigrants from Sweden by 11th Grade
In terms of 11th grade, the demographic groups most similar to Immigrants from Sweden are Native Hawaiian (93.9%, a difference of 0.0%), Alaskan Athabascan (93.9%, a difference of 0.020%), Immigrants from Netherlands (93.9%, a difference of 0.020%), Ukrainian (94.0%, a difference of 0.030%), and Zimbabwean (93.9%, a difference of 0.040%).
| Demographics | Rating | Rank | 11th Grade |
| New Zealanders | 99.9 /100 | #57 | Exceptional 94.0% |
| Iranians | 99.9 /100 | #58 | Exceptional 94.0% |
| Bhutanese | 99.8 /100 | #59 | Exceptional 94.0% |
| Okinawans | 99.8 /100 | #60 | Exceptional 94.0% |
| Immigrants | Belgium | 99.8 /100 | #61 | Exceptional 94.0% |
| Austrians | 99.8 /100 | #62 | Exceptional 94.0% |
| Ukrainians | 99.8 /100 | #63 | Exceptional 94.0% |
| Immigrants | Sweden | 99.8 /100 | #64 | Exceptional 93.9% |
| Native Hawaiians | 99.8 /100 | #65 | Exceptional 93.9% |
| Alaskan Athabascans | 99.8 /100 | #66 | Exceptional 93.9% |
| Immigrants | Netherlands | 99.8 /100 | #67 | Exceptional 93.9% |
| Zimbabweans | 99.8 /100 | #68 | Exceptional 93.9% |
| Scotch-Irish | 99.8 /100 | #69 | Exceptional 93.9% |
| Immigrants | England | 99.7 /100 | #70 | Exceptional 93.8% |
| Immigrants | South Africa | 99.7 /100 | #71 | Exceptional 93.8% |