Lithuanian vs Immigrants from Morocco 11th Grade
COMPARE
Lithuanian
Immigrants from Morocco
11th Grade
11th Grade Comparison
Lithuanians
Immigrants from Morocco
94.8%
11TH GRADE
100.0/ 100
METRIC RATING
6th/ 347
METRIC RANK
92.4%
11TH GRADE
38.6/ 100
METRIC RATING
182nd/ 347
METRIC RANK
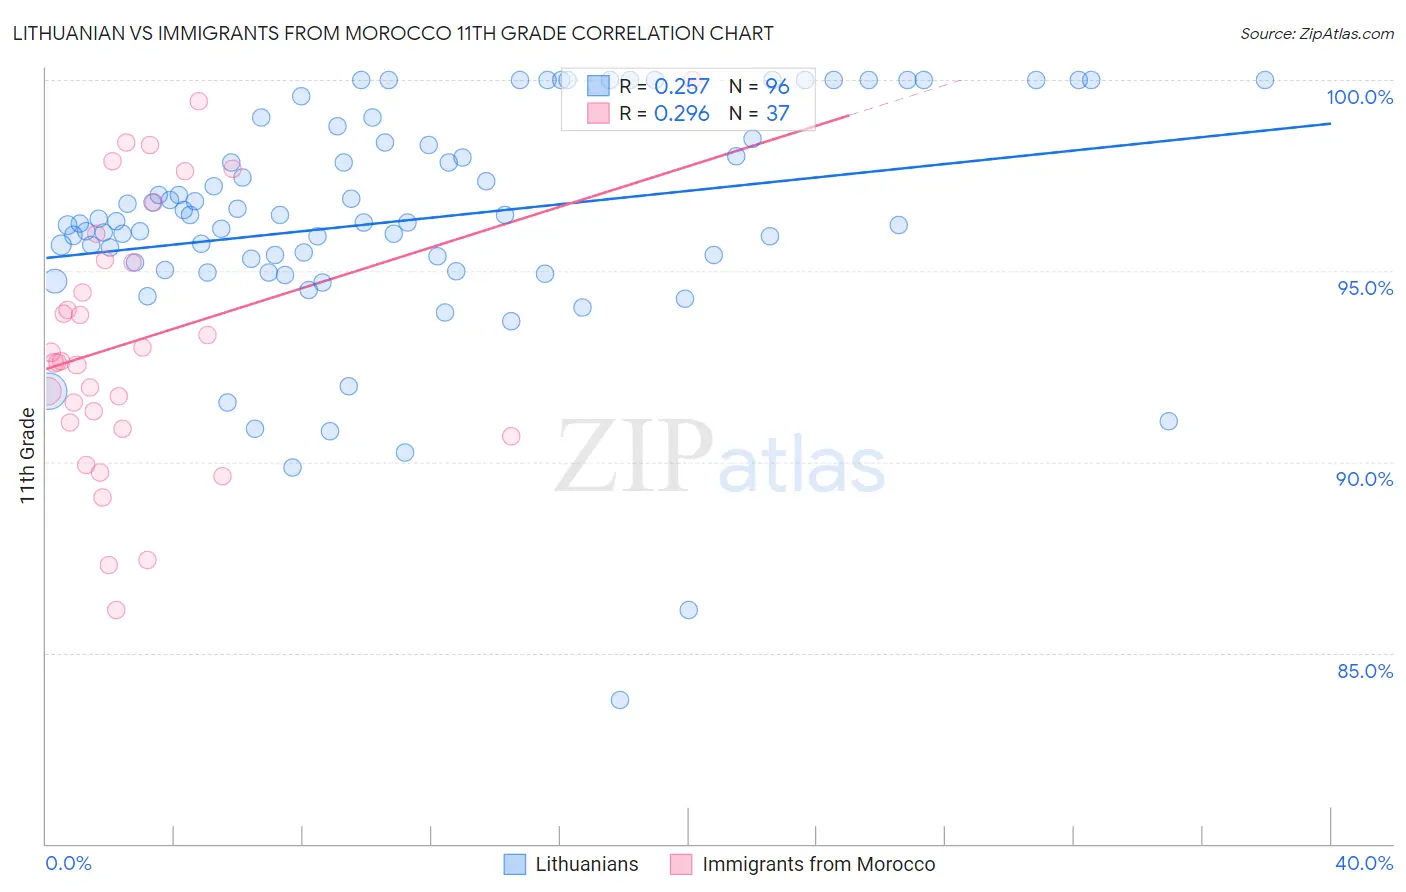
Lithuanian vs Immigrants from Morocco 11th Grade Correlation Chart
The statistical analysis conducted on geographies consisting of 421,947,832 people shows a weak positive correlation between the proportion of Lithuanians and percentage of population with at least 11th grade education in the United States with a correlation coefficient (R) of 0.257 and weighted average of 94.8%. Similarly, the statistical analysis conducted on geographies consisting of 178,912,438 people shows a weak positive correlation between the proportion of Immigrants from Morocco and percentage of population with at least 11th grade education in the United States with a correlation coefficient (R) of 0.296 and weighted average of 92.4%, a difference of 2.6%.
11th Grade Correlation Summary
| Measurement | Lithuanian | Immigrants from Morocco |
| Minimum | 83.8% | 86.1% |
| Maximum | 100.0% | 100.0% |
| Range | 16.2% | 13.9% |
| Mean | 96.3% | 93.2% |
| Median | 96.3% | 92.6% |
| Interquartile 25% (IQ1) | 95.1% | 91.0% |
| Interquartile 75% (IQ3) | 98.4% | 95.6% |
| Interquartile Range (IQR) | 3.3% | 4.7% |
| Standard Deviation (Sample) | 3.0% | 3.5% |
| Standard Deviation (Population) | 3.0% | 3.4% |
Similar Demographics by 11th Grade
Demographics Similar to Lithuanians by 11th Grade
In terms of 11th grade, the demographic groups most similar to Lithuanians are Carpatho Rusyn (94.8%, a difference of 0.050%), Polish (94.8%, a difference of 0.050%), Croatian (94.7%, a difference of 0.060%), Danish (94.7%, a difference of 0.10%), and Slovak (94.9%, a difference of 0.11%).
| Demographics | Rating | Rank | 11th Grade |
| Norwegians | 100.0 /100 | #1 | Exceptional 95.2% |
| Swedes | 100.0 /100 | #2 | Exceptional 94.9% |
| Slovenes | 100.0 /100 | #3 | Exceptional 94.9% |
| Slovaks | 100.0 /100 | #4 | Exceptional 94.9% |
| Carpatho Rusyns | 100.0 /100 | #5 | Exceptional 94.8% |
| Lithuanians | 100.0 /100 | #6 | Exceptional 94.8% |
| Poles | 100.0 /100 | #7 | Exceptional 94.8% |
| Croatians | 100.0 /100 | #8 | Exceptional 94.7% |
| Danes | 100.0 /100 | #9 | Exceptional 94.7% |
| Finns | 100.0 /100 | #10 | Exceptional 94.7% |
| Germans | 100.0 /100 | #11 | Exceptional 94.7% |
| Latvians | 100.0 /100 | #12 | Exceptional 94.7% |
| Chinese | 100.0 /100 | #13 | Exceptional 94.6% |
| Eastern Europeans | 100.0 /100 | #14 | Exceptional 94.6% |
| Bulgarians | 100.0 /100 | #15 | Exceptional 94.5% |
Demographics Similar to Immigrants from Morocco by 11th Grade
In terms of 11th grade, the demographic groups most similar to Immigrants from Morocco are Immigrants from Malaysia (92.4%, a difference of 0.010%), Immigrants from Asia (92.4%, a difference of 0.010%), Creek (92.4%, a difference of 0.020%), Inupiat (92.4%, a difference of 0.020%), and Cherokee (92.4%, a difference of 0.020%).
| Demographics | Rating | Rank | 11th Grade |
| Shoshone | 48.9 /100 | #175 | Average 92.5% |
| Spaniards | 46.9 /100 | #176 | Average 92.5% |
| Guamanians/Chamorros | 45.0 /100 | #177 | Average 92.5% |
| Sudanese | 43.4 /100 | #178 | Average 92.5% |
| Creek | 40.9 /100 | #179 | Average 92.4% |
| Inupiat | 40.7 /100 | #180 | Average 92.4% |
| Cherokee | 40.7 /100 | #181 | Average 92.4% |
| Immigrants | Morocco | 38.6 /100 | #182 | Fair 92.4% |
| Immigrants | Malaysia | 37.6 /100 | #183 | Fair 92.4% |
| Immigrants | Asia | 37.4 /100 | #184 | Fair 92.4% |
| Immigrants | Nepal | 36.4 /100 | #185 | Fair 92.4% |
| Arapaho | 35.1 /100 | #186 | Fair 92.4% |
| Immigrants | Western Asia | 35.0 /100 | #187 | Fair 92.4% |
| Immigrants | Indonesia | 33.7 /100 | #188 | Fair 92.4% |
| Immigrants | Chile | 33.3 /100 | #189 | Fair 92.4% |