Lithuanian vs Immigrants from South Africa 11th Grade
COMPARE
Lithuanian
Immigrants from South Africa
11th Grade
11th Grade Comparison
Lithuanians
Immigrants from South Africa
94.8%
11TH GRADE
100.0/ 100
METRIC RATING
6th/ 347
METRIC RANK
93.8%
11TH GRADE
99.7/ 100
METRIC RATING
71st/ 347
METRIC RANK
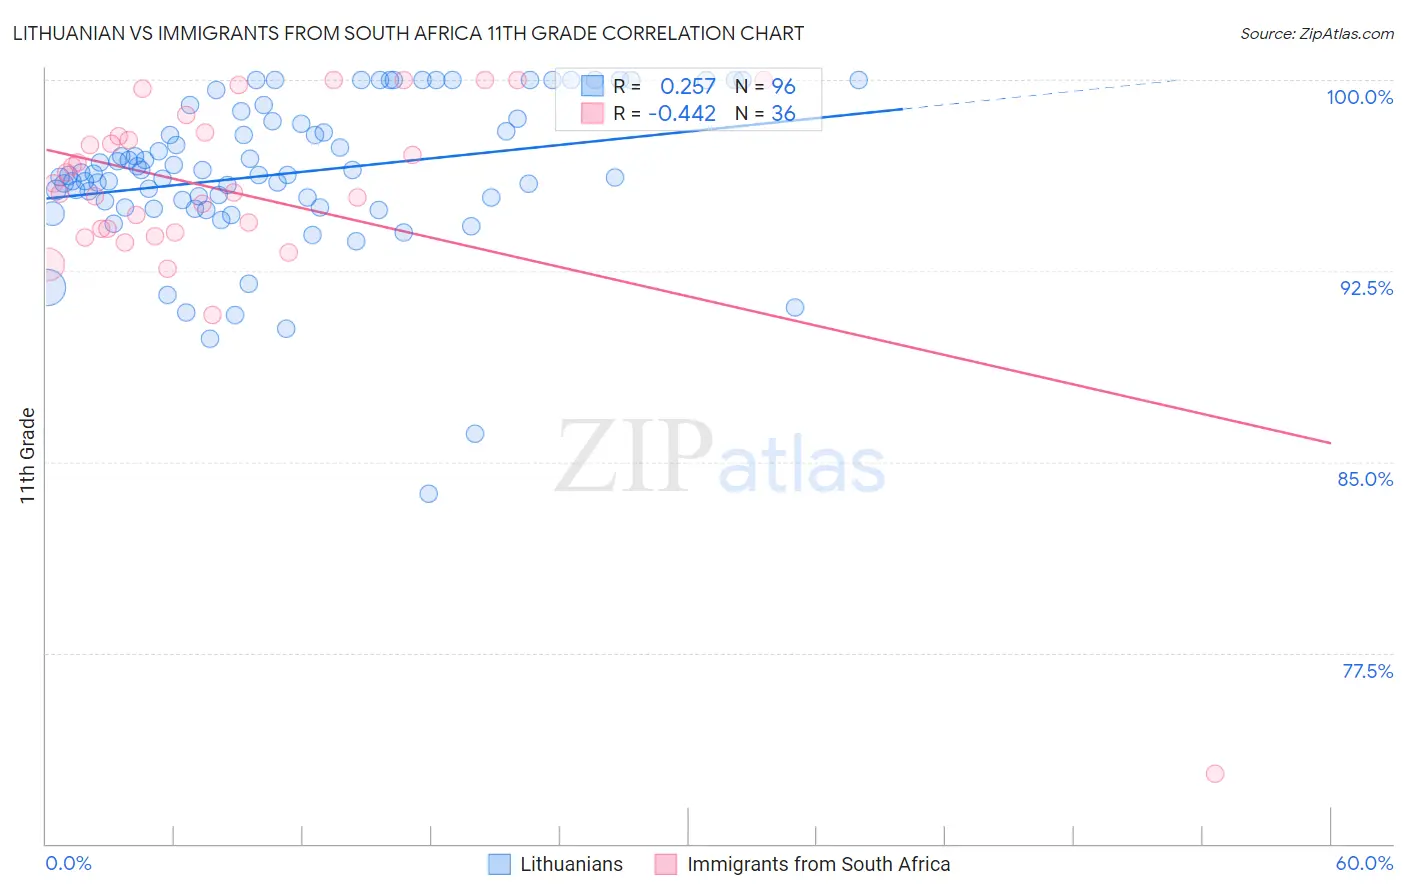
Lithuanian vs Immigrants from South Africa 11th Grade Correlation Chart
The statistical analysis conducted on geographies consisting of 421,947,832 people shows a weak positive correlation between the proportion of Lithuanians and percentage of population with at least 11th grade education in the United States with a correlation coefficient (R) of 0.257 and weighted average of 94.8%. Similarly, the statistical analysis conducted on geographies consisting of 233,321,693 people shows a moderate negative correlation between the proportion of Immigrants from South Africa and percentage of population with at least 11th grade education in the United States with a correlation coefficient (R) of -0.442 and weighted average of 93.8%, a difference of 1.0%.
11th Grade Correlation Summary
| Measurement | Lithuanian | Immigrants from South Africa |
| Minimum | 83.8% | 72.7% |
| Maximum | 100.0% | 100.0% |
| Range | 16.2% | 27.3% |
| Mean | 96.3% | 95.6% |
| Median | 96.3% | 95.8% |
| Interquartile 25% (IQ1) | 95.1% | 94.1% |
| Interquartile 75% (IQ3) | 98.4% | 97.8% |
| Interquartile Range (IQR) | 3.3% | 3.8% |
| Standard Deviation (Sample) | 3.0% | 4.6% |
| Standard Deviation (Population) | 3.0% | 4.6% |
Similar Demographics by 11th Grade
Demographics Similar to Lithuanians by 11th Grade
In terms of 11th grade, the demographic groups most similar to Lithuanians are Carpatho Rusyn (94.8%, a difference of 0.050%), Polish (94.8%, a difference of 0.050%), Croatian (94.7%, a difference of 0.060%), Danish (94.7%, a difference of 0.10%), and Slovak (94.9%, a difference of 0.11%).
| Demographics | Rating | Rank | 11th Grade |
| Norwegians | 100.0 /100 | #1 | Exceptional 95.2% |
| Swedes | 100.0 /100 | #2 | Exceptional 94.9% |
| Slovenes | 100.0 /100 | #3 | Exceptional 94.9% |
| Slovaks | 100.0 /100 | #4 | Exceptional 94.9% |
| Carpatho Rusyns | 100.0 /100 | #5 | Exceptional 94.8% |
| Lithuanians | 100.0 /100 | #6 | Exceptional 94.8% |
| Poles | 100.0 /100 | #7 | Exceptional 94.8% |
| Croatians | 100.0 /100 | #8 | Exceptional 94.7% |
| Danes | 100.0 /100 | #9 | Exceptional 94.7% |
| Finns | 100.0 /100 | #10 | Exceptional 94.7% |
| Germans | 100.0 /100 | #11 | Exceptional 94.7% |
| Latvians | 100.0 /100 | #12 | Exceptional 94.7% |
| Chinese | 100.0 /100 | #13 | Exceptional 94.6% |
| Eastern Europeans | 100.0 /100 | #14 | Exceptional 94.6% |
| Bulgarians | 100.0 /100 | #15 | Exceptional 94.5% |
Demographics Similar to Immigrants from South Africa by 11th Grade
In terms of 11th grade, the demographic groups most similar to Immigrants from South Africa are Immigrants from England (93.8%, a difference of 0.010%), Immigrants from Japan (93.8%, a difference of 0.030%), Romanian (93.8%, a difference of 0.050%), Immigrants from Czechoslovakia (93.8%, a difference of 0.050%), and Scotch-Irish (93.9%, a difference of 0.060%).
| Demographics | Rating | Rank | 11th Grade |
| Immigrants | Sweden | 99.8 /100 | #64 | Exceptional 93.9% |
| Native Hawaiians | 99.8 /100 | #65 | Exceptional 93.9% |
| Alaskan Athabascans | 99.8 /100 | #66 | Exceptional 93.9% |
| Immigrants | Netherlands | 99.8 /100 | #67 | Exceptional 93.9% |
| Zimbabweans | 99.8 /100 | #68 | Exceptional 93.9% |
| Scotch-Irish | 99.8 /100 | #69 | Exceptional 93.9% |
| Immigrants | England | 99.7 /100 | #70 | Exceptional 93.8% |
| Immigrants | South Africa | 99.7 /100 | #71 | Exceptional 93.8% |
| Immigrants | Japan | 99.7 /100 | #72 | Exceptional 93.8% |
| Romanians | 99.6 /100 | #73 | Exceptional 93.8% |
| Immigrants | Czechoslovakia | 99.6 /100 | #74 | Exceptional 93.8% |
| Immigrants | Latvia | 99.6 /100 | #75 | Exceptional 93.8% |
| Celtics | 99.5 /100 | #76 | Exceptional 93.7% |
| Aleuts | 99.5 /100 | #77 | Exceptional 93.7% |
| Soviet Union | 99.5 /100 | #78 | Exceptional 93.7% |