Lithuanian vs Pima 11th Grade
COMPARE
Lithuanian
Pima
11th Grade
11th Grade Comparison
Lithuanians
Pima
94.8%
11TH GRADE
100.0/ 100
METRIC RATING
6th/ 347
METRIC RANK
88.3%
11TH GRADE
0.0/ 100
METRIC RATING
323rd/ 347
METRIC RANK
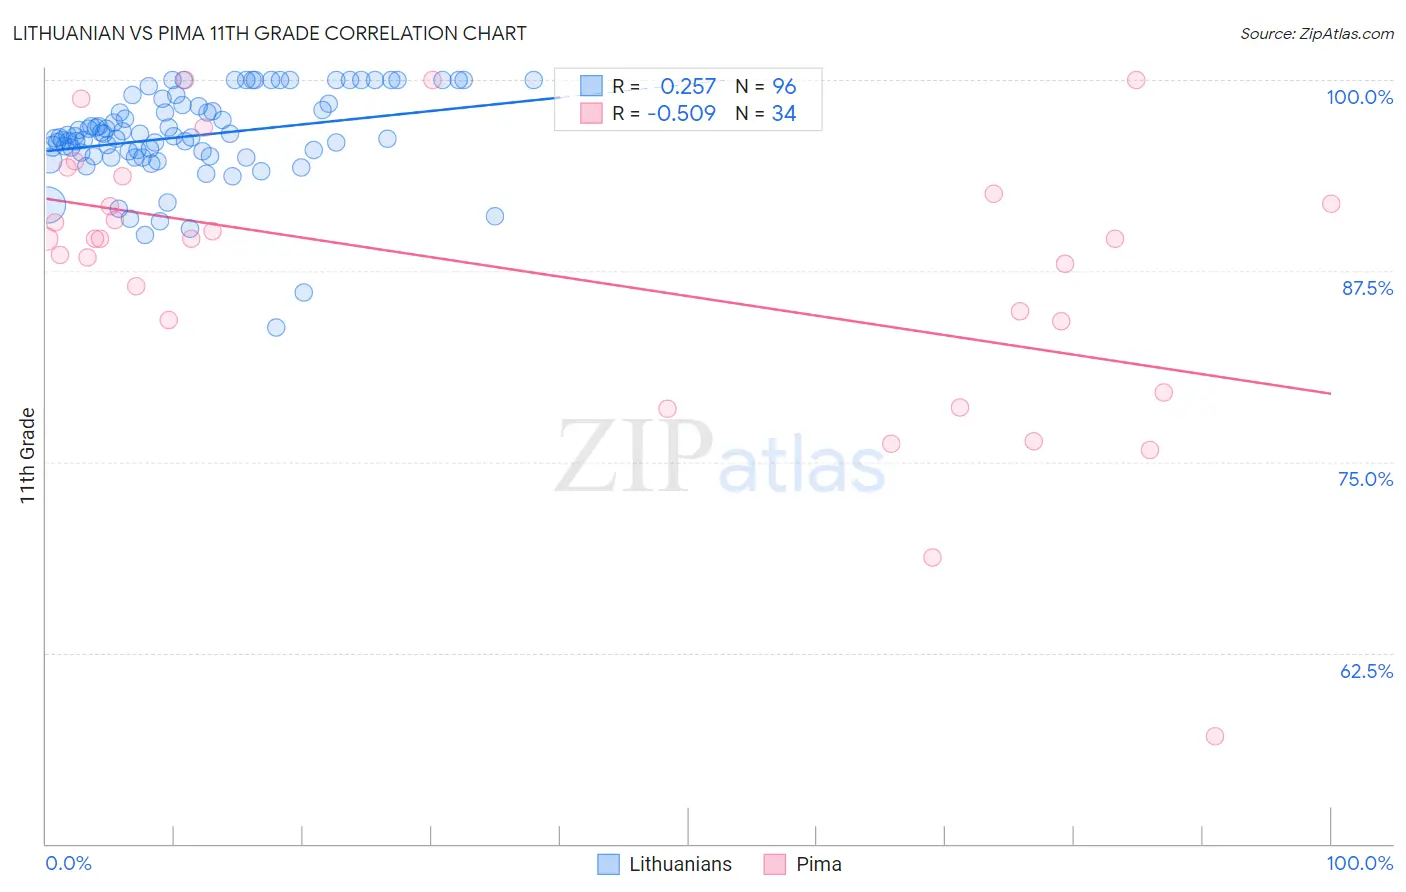
Lithuanian vs Pima 11th Grade Correlation Chart
The statistical analysis conducted on geographies consisting of 421,947,832 people shows a weak positive correlation between the proportion of Lithuanians and percentage of population with at least 11th grade education in the United States with a correlation coefficient (R) of 0.257 and weighted average of 94.8%. Similarly, the statistical analysis conducted on geographies consisting of 61,552,942 people shows a substantial negative correlation between the proportion of Pima and percentage of population with at least 11th grade education in the United States with a correlation coefficient (R) of -0.509 and weighted average of 88.3%, a difference of 7.4%.
11th Grade Correlation Summary
| Measurement | Lithuanian | Pima |
| Minimum | 83.8% | 57.0% |
| Maximum | 100.0% | 100.0% |
| Range | 16.2% | 43.0% |
| Mean | 96.3% | 87.3% |
| Median | 96.3% | 89.6% |
| Interquartile 25% (IQ1) | 95.1% | 84.2% |
| Interquartile 75% (IQ3) | 98.4% | 92.6% |
| Interquartile Range (IQR) | 3.3% | 8.4% |
| Standard Deviation (Sample) | 3.0% | 9.3% |
| Standard Deviation (Population) | 3.0% | 9.2% |
Similar Demographics by 11th Grade
Demographics Similar to Lithuanians by 11th Grade
In terms of 11th grade, the demographic groups most similar to Lithuanians are Carpatho Rusyn (94.8%, a difference of 0.050%), Polish (94.8%, a difference of 0.050%), Croatian (94.7%, a difference of 0.060%), Danish (94.7%, a difference of 0.10%), and Slovak (94.9%, a difference of 0.11%).
| Demographics | Rating | Rank | 11th Grade |
| Norwegians | 100.0 /100 | #1 | Exceptional 95.2% |
| Swedes | 100.0 /100 | #2 | Exceptional 94.9% |
| Slovenes | 100.0 /100 | #3 | Exceptional 94.9% |
| Slovaks | 100.0 /100 | #4 | Exceptional 94.9% |
| Carpatho Rusyns | 100.0 /100 | #5 | Exceptional 94.8% |
| Lithuanians | 100.0 /100 | #6 | Exceptional 94.8% |
| Poles | 100.0 /100 | #7 | Exceptional 94.8% |
| Croatians | 100.0 /100 | #8 | Exceptional 94.7% |
| Danes | 100.0 /100 | #9 | Exceptional 94.7% |
| Finns | 100.0 /100 | #10 | Exceptional 94.7% |
| Germans | 100.0 /100 | #11 | Exceptional 94.7% |
| Latvians | 100.0 /100 | #12 | Exceptional 94.7% |
| Chinese | 100.0 /100 | #13 | Exceptional 94.6% |
| Eastern Europeans | 100.0 /100 | #14 | Exceptional 94.6% |
| Bulgarians | 100.0 /100 | #15 | Exceptional 94.5% |
Demographics Similar to Pima by 11th Grade
In terms of 11th grade, the demographic groups most similar to Pima are Central American Indian (88.2%, a difference of 0.040%), Puerto Rican (88.4%, a difference of 0.080%), Immigrants from Nicaragua (88.1%, a difference of 0.17%), Immigrants from Belize (88.7%, a difference of 0.47%), and Immigrants from Armenia (88.8%, a difference of 0.55%).
| Demographics | Rating | Rank | 11th Grade |
| Immigrants | Cuba | 0.0 /100 | #316 | Tragic 88.9% |
| Lumbee | 0.0 /100 | #317 | Tragic 88.9% |
| Nicaraguans | 0.0 /100 | #318 | Tragic 88.9% |
| Belizeans | 0.0 /100 | #319 | Tragic 88.8% |
| Immigrants | Armenia | 0.0 /100 | #320 | Tragic 88.8% |
| Immigrants | Belize | 0.0 /100 | #321 | Tragic 88.7% |
| Puerto Ricans | 0.0 /100 | #322 | Tragic 88.4% |
| Pima | 0.0 /100 | #323 | Tragic 88.3% |
| Central American Indians | 0.0 /100 | #324 | Tragic 88.2% |
| Immigrants | Nicaragua | 0.0 /100 | #325 | Tragic 88.1% |
| Dominicans | 0.0 /100 | #326 | Tragic 87.7% |
| Immigrants | Cabo Verde | 0.0 /100 | #327 | Tragic 87.6% |
| Tohono O'odham | 0.0 /100 | #328 | Tragic 87.6% |
| Mexican American Indians | 0.0 /100 | #329 | Tragic 87.5% |
| Hondurans | 0.0 /100 | #330 | Tragic 87.4% |